Easy Tech Tuts
How to use Bar Replay in Tradingview for Free, Solve Not Working, Alternatives 2026
By Impran M N
Bar Replay lets you rewind a TradingView chart to any earlier point and step forward bar by bar, watching a setup unfold the way it happened instead of judging it in hindsight. This guide covers turning it on from a live chart, what its controls do, and where the real limits sit — which is not quite where most people assume. By the end you'll know which button does what and what to check first when the replay toolbar refuses to appear.
Before you start
- A TradingView account, signed in
01Start from a normal chart before turning on replay
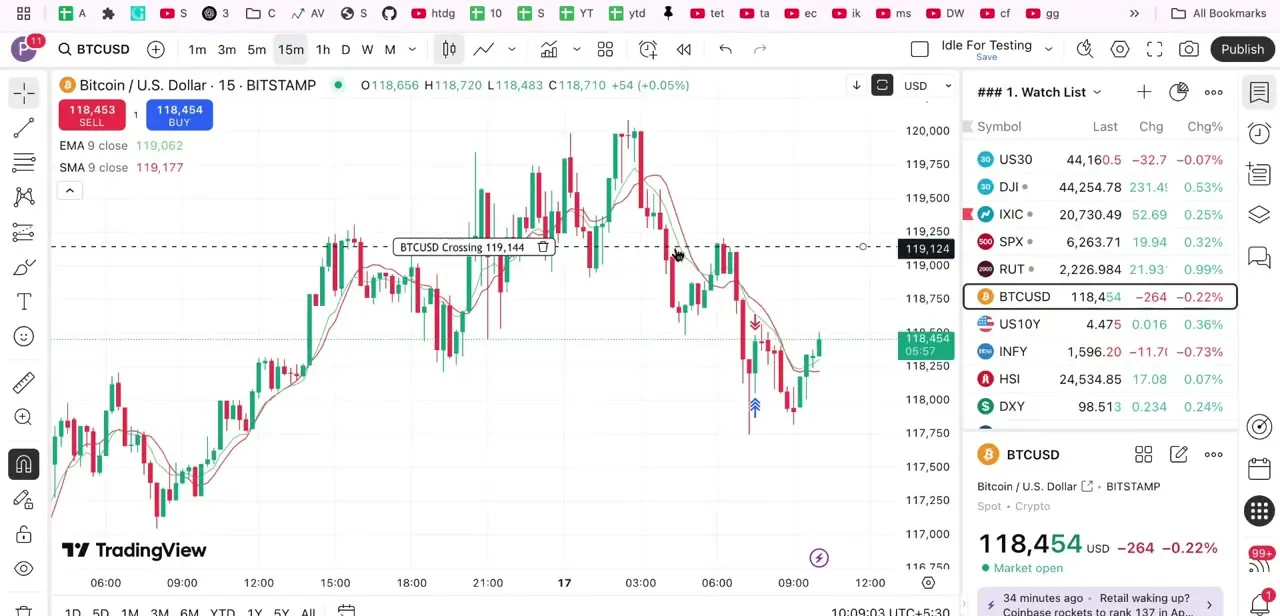
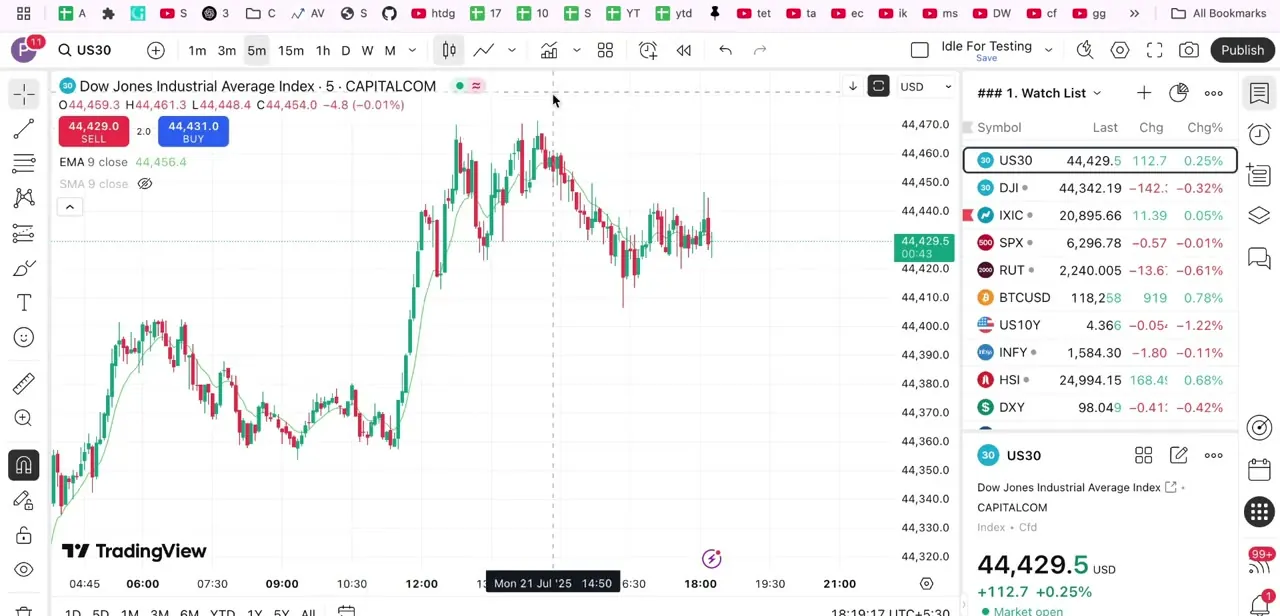
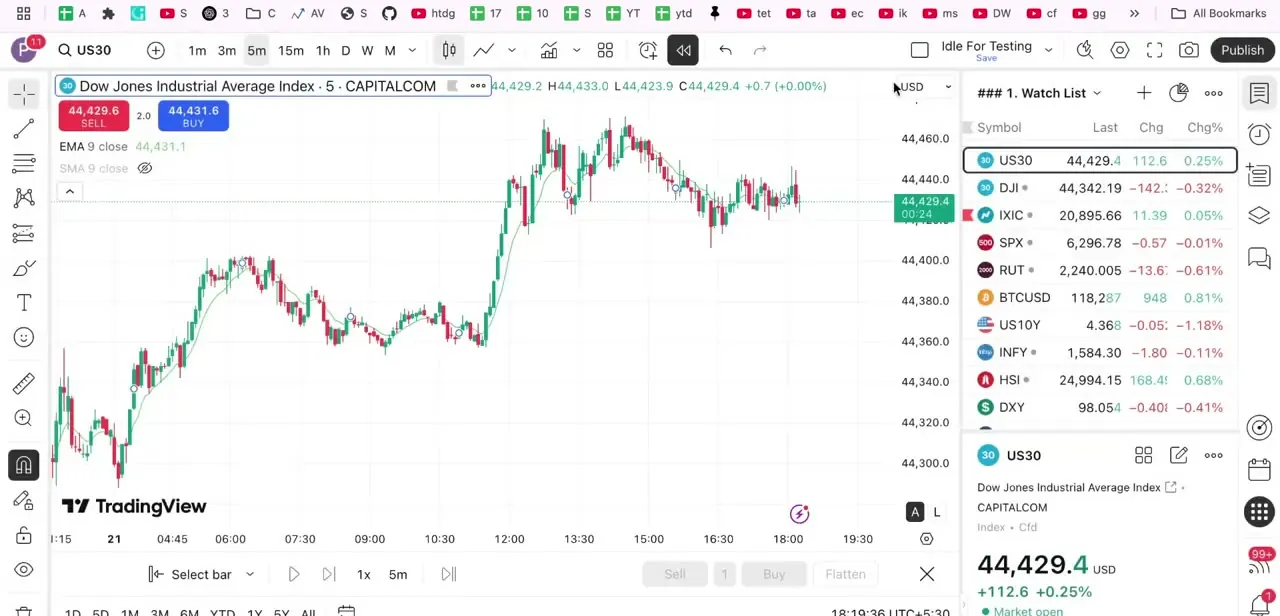
Open the instrument you want to practice on — in this walkthrough it's the Dow Jones Industrial Average on a 5-minute timeframe, with the watchlist docked on the right showing other indices and symbols for reference. This is your baseline: a live, unmodified chart with the standard toolbar across the top and drawing tools down the left side. Bar Replay sits among the chart's top-toolbar icons, easy to miss next to the more commonly used indicator and alert buttons.
02Turn on Bar Replay and pick your starting bar
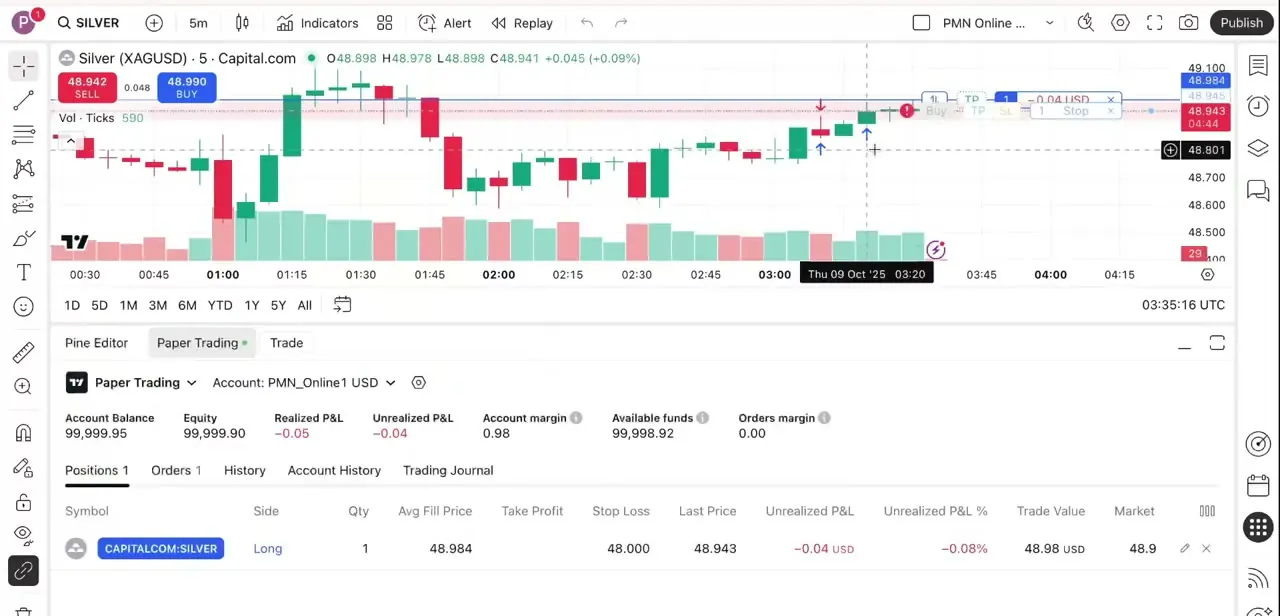
Click the Bar Replay icon and the chart drops into starting-point selection: hover over the price history and a vertical guide follows the cursor. Click the point you want to start from and everything after it disappears from view until you play it back. A new control bar appears at the bottom of the chart with playback controls (step back, play, step forward) and a speed selector currently set to 1x, plus Buy and Sell buttons that let you place simulated trades right from the replay bar, as if you were trading live.
03Set the replay interval for how fast bars reveal
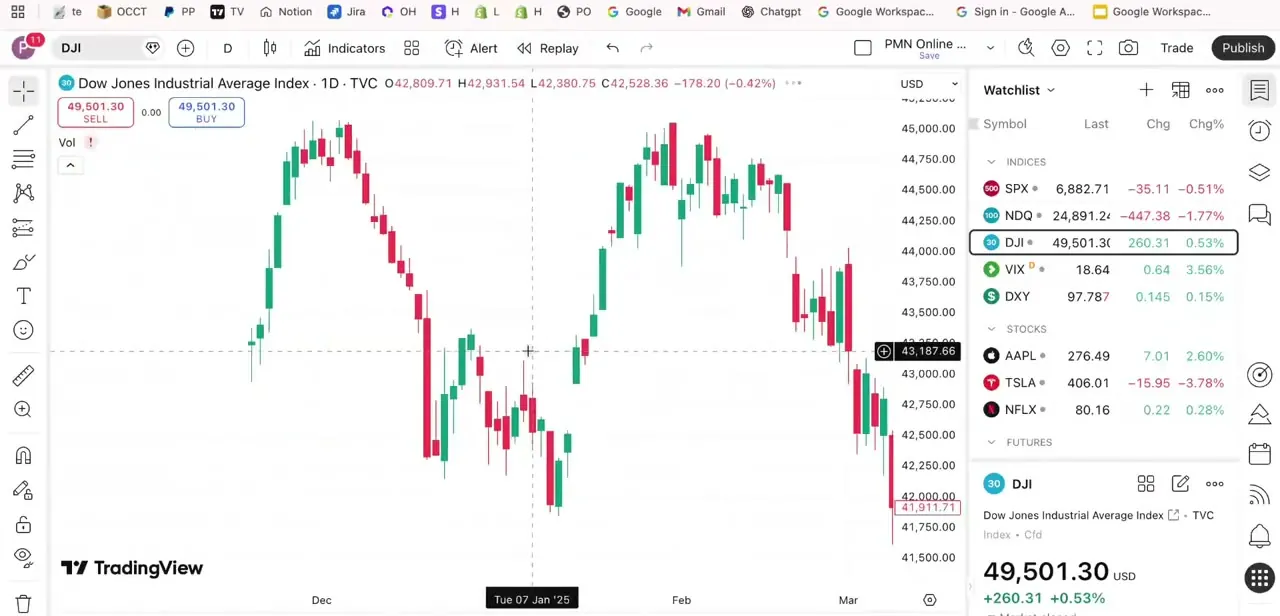
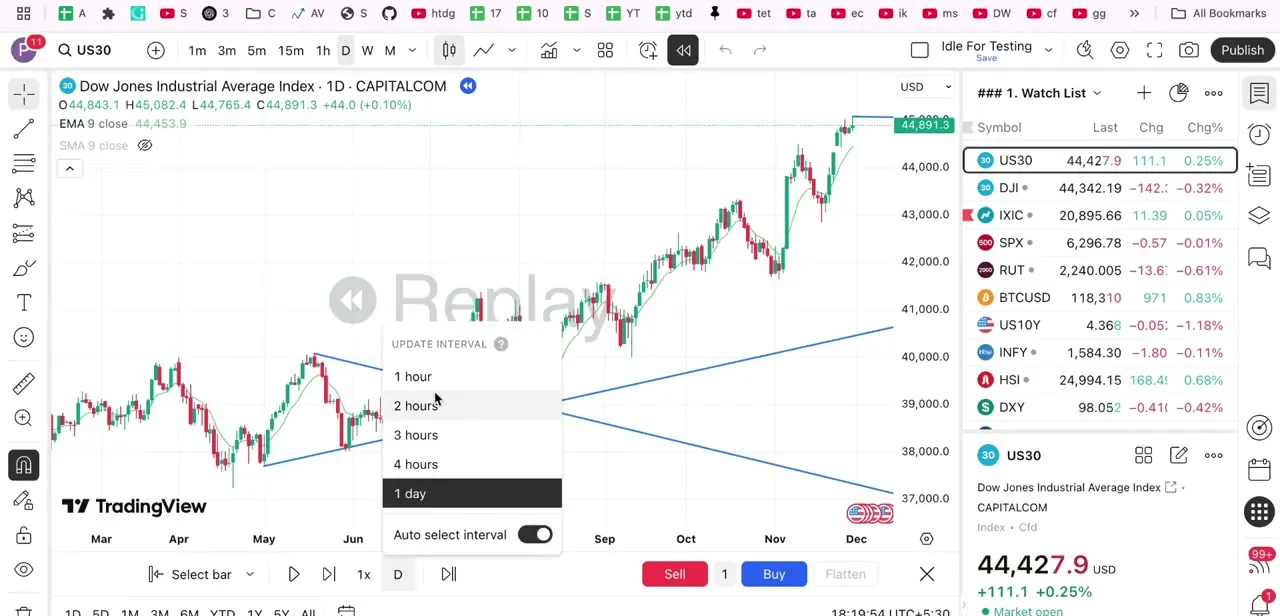
Switching to a daily chart and clicking the interval control opens a menu with choices like 1 hour, 2 hours, 3 hours, 4 hours, 1 day, or Auto select interval. This is the amount of time added to the chart with each step of playback — TradingView's own docs describe it as one data update per tick of replay. The options on offer depend on your chart's own timeframe (a 1-minute chart won't offer a 4-hour interval), so it isn't a fully separate setting, but within what's available it lets you blow through a slow multi-month range quickly while still watching each candle form individually instead of jumping straight to the end.
04Step through and place simulated trades
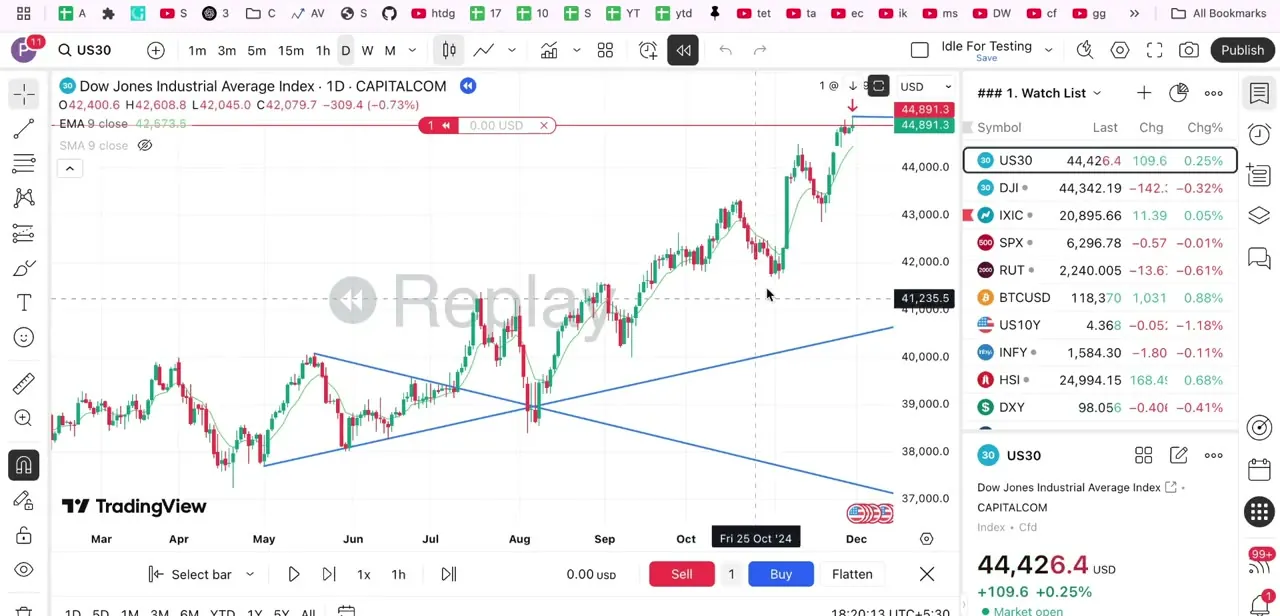
With a starting bar and interval chosen, use the play button to run replay forward automatically or the step buttons to advance one bar at a time. The Buy, Sell, and Flatten controls let you open and close a simulated position as price moves, complete with a quantity field and a running order line on the chart — TradingView calls this Replay Trading, and the trade markers it draws on the chart are called Executions. Nothing from a replay session is saved once it ends; it exists only for that run.
| Plan | 1-minute replay history |
|---|---|
| Basic (free) | Not available — replay works on daily and higher timeframes only |
| Essential | 6 months (scales up for coarser intraday intervals, e.g. 12 months at 2-minute) |
| Plus | 1 year (scales up similarly, e.g. 2 years at 2-minute) |
| Premium & Professional | All stored 1-minute data for the symbol — back to 2000-2011 for some |
Daily and longer timeframes give every plan the symbol's full stored history for replay. Figures are TradingView's own, checked against their support documentation in September 2026.
When it doesn't work
Clicking Bar Replay does nothing — no toolbar appears at the bottom of the chart
Why: The chart is on a type or symbol Bar Replay doesn't support: Renko, Kagi, Point & Figure, Range, Line Break, Volume Footprint or Time Price Opportunity charts, a spread (formula) symbol, or a symbol converted to a non-default currency.
Fix: Switch to a standard candlestick or bar chart on a regular symbol, then click Bar Replay again.
The starting bar won't go back as far as I need on an intraday chart
Why: This is a plan limit rather than a bug. A free Basic account only gets Bar Replay on daily-and-higher timeframes; deeper intraday history needs Essential or a higher plan.
Fix: Switch the chart to a daily timeframe, or upgrade if intraday replay depth is what you actually need.
Buy/Sell trade markers clutter the chart every time you replay
Why: Executions and Execution Labels are on by default in Replay Trading.
Fix: Open Settings, go to the Trading tab, and turn off Executions and Execution Labels.
Frequently asked questions
Is Bar Replay free on TradingView?
Yes, Bar Replay itself doesn't need a paid plan. What's gated is intraday depth: a free Basic account only replays daily-and-higher timeframes, so 1-minute or 5-minute replay needs an Essential plan or above.
Why doesn't the Bar Replay toolbar appear when I click it?
Almost always an unsupported chart type or symbol: Renko, Kagi, Point & Figure, Range, Line Break, Volume Footprint, Time Price Opportunity, a spread symbol, or a currency-converted symbol. Switch to a standard chart type and a regular symbol and try again.
What does the replay interval control?
How much time is added to the chart with each step — for example 1 minute or 1 day. The options depend on your chart's own timeframe, and TradingView auto-selects a sensible one when it's set to Auto.
Can I place simulated trades during replay without a paid plan?
Yes. Replay Trading's Buy, Sell, and Flatten controls work on a Basic account within whatever timeframe replay is available to you on that plan.
What can I do if my plan's replay range isn't long enough?
Scroll the chart manually to the period you want and track price action bar by bar without the automated controls, or build a Pine Script backtesting strategy instead of relying on manual replay. Neither fully replaces Bar Replay, but both work within a free plan while you decide whether upgrading is worth it.
Sources and last check
Click path and screens come from a walkthrough recorded in July 2025. Plan limits, unsupported chart types, the replay-interval behaviour, and the Executions terminology were re-checked against TradingView's official Help Center in September 2026. That check corrected the article's earlier claim that free-plan replay is limited mainly by how far back you can start — the real free-plan limit is that intraday timeframes aren't replayable at all on Basic, only daily and higher — and added the unsupported-chart-type and Executions-toggle details it didn't previously carry.
- TradingView Help Center: How do I turn Bar Replay on? (official)
- TradingView Help Center: How much data is available for Bar Replay? (official)
- TradingView Help Center: Bar Replay doesn't work, there is no Replay toolbar (official)
- TradingView Help Center: Learn to trade on historical data (official)
- TradingView Help Center: How do I disable Executions in Bar Replay? (official)
- TradingView Help Center: How to select replay interval for the Bar Replay (official)
About the author

Impran M N
I've been hooked on technology for as long as I can remember — especially the new tools and AI apps that seem to land every other week. Easy Tech Tuts is where I write up whatever I've just worked out: I do the task in the real product, record the screen, and turn it into the guide I wish I'd found first.