Easy Tech Tuts
How to Backtest on TradingView for Free 2026 Easily
By Impran M N
Backtesting lets you check whether a trading strategy holds up before risking real money on it, and TradingView's Bar Replay tool makes this possible on the free Basic plan, no paid subscription required for the core feature. This guide covers turning on Replay mode, stepping through historical price data candle by candle, and simulating trades as if watching them unfold live. It also covers a real constraint the free plan carries: full intraday replay depth is gated to paid tiers, so which timeframe you choose matters.
01Understand what Bar Replay simulates
Bar Replay hides everything after a point you choose on the chart and reveals candles one at a time as you click forward, recreating the experience of watching a market develop without knowing what comes next. This differs from scrolling back through history and eyeballing patterns, because it forces entry and exit decisions blind to the outcome, which is the point of a meaningful backtest. It doesn't work on every chart type: TradingView's own documentation excludes Renko, Kagi, Point & Figure, Range, Line Break, Volume Footprint and Time Price Opportunity charts, along with spread and tick-based charts, from Replay.
02Open a chart and check your current view
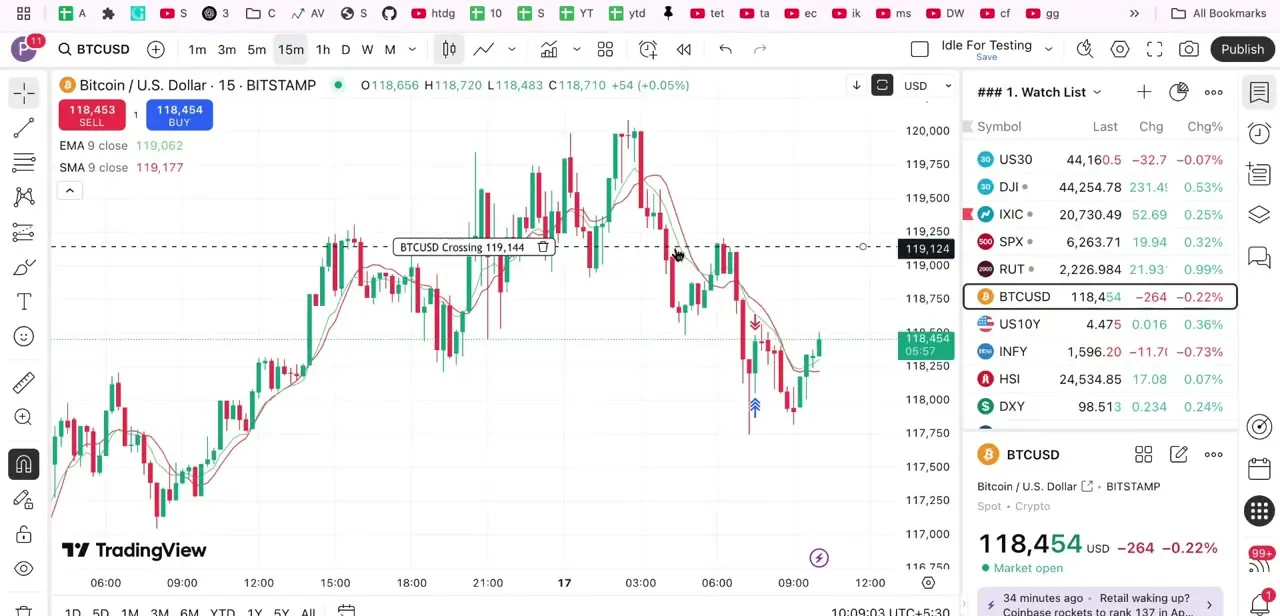
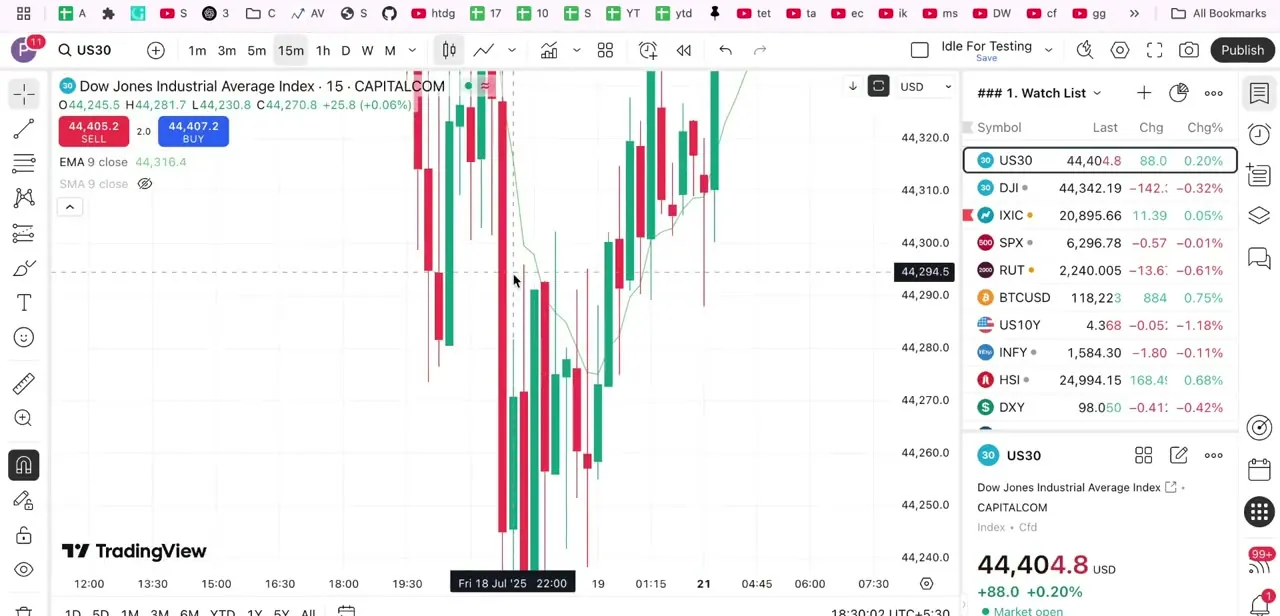
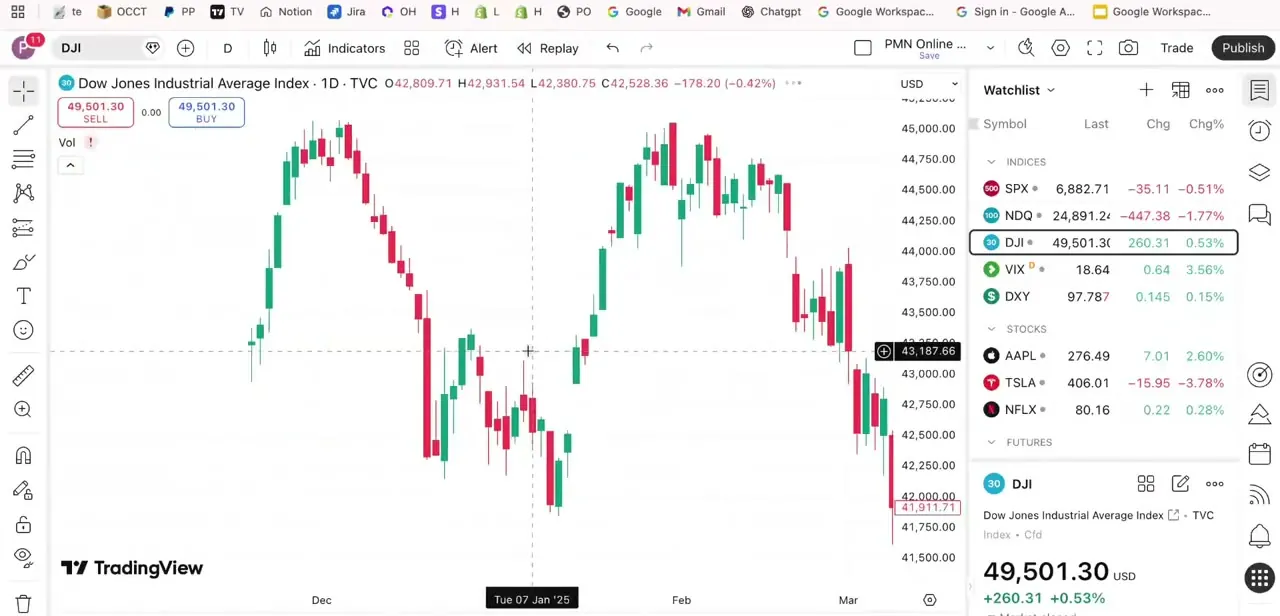
Load the symbol you want to test, an index, stock, or crypto pair, and set your timeframe first. On the free Basic plan, daily and higher timeframes give you all of a symbol's available history in Replay; intraday timeframes are where the free plan runs into a real limit, covered in the next step. The right-hand watchlist panel is worth keeping open too, since comparing your test symbol against related instruments gives useful context for whether a signal is specific to that chart or part of a broader market move.
03Turn on Replay and pick your starting bar
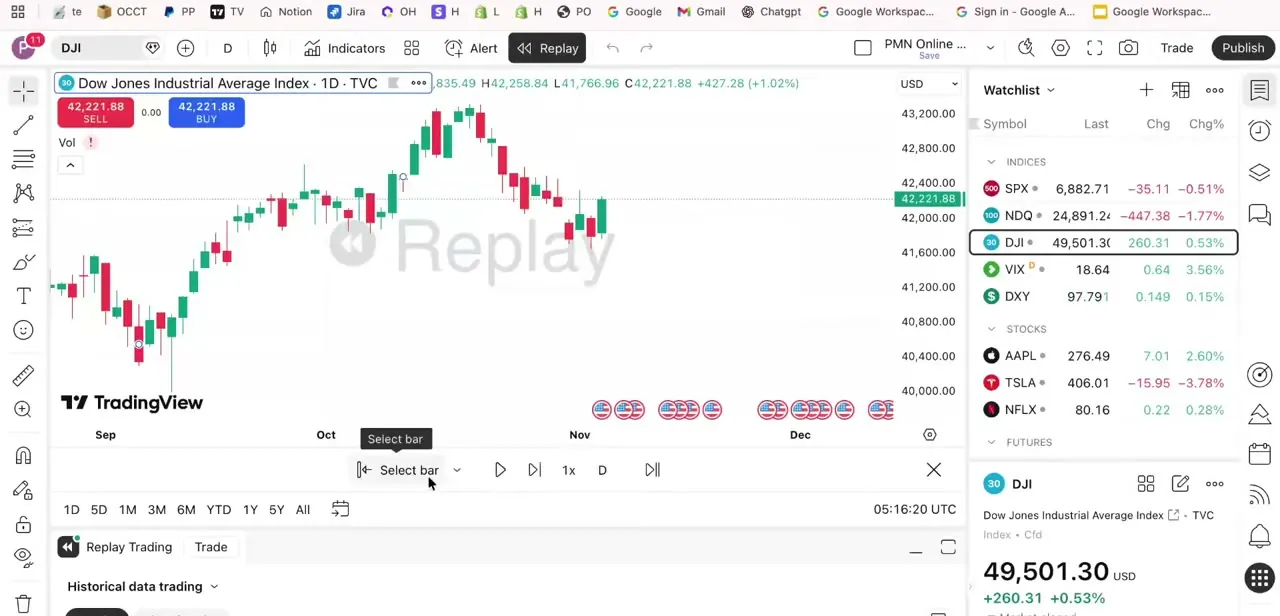
Click the Replay button in the top toolbar. You can set the starting point three ways: hover the chart and click a specific bar, choose "Select the first available day" to start from the earliest history TradingView has, or use "Random bar" to let TradingView pick one for you, which is a built-in way to sidestep the hindsight bias described later in this guide.
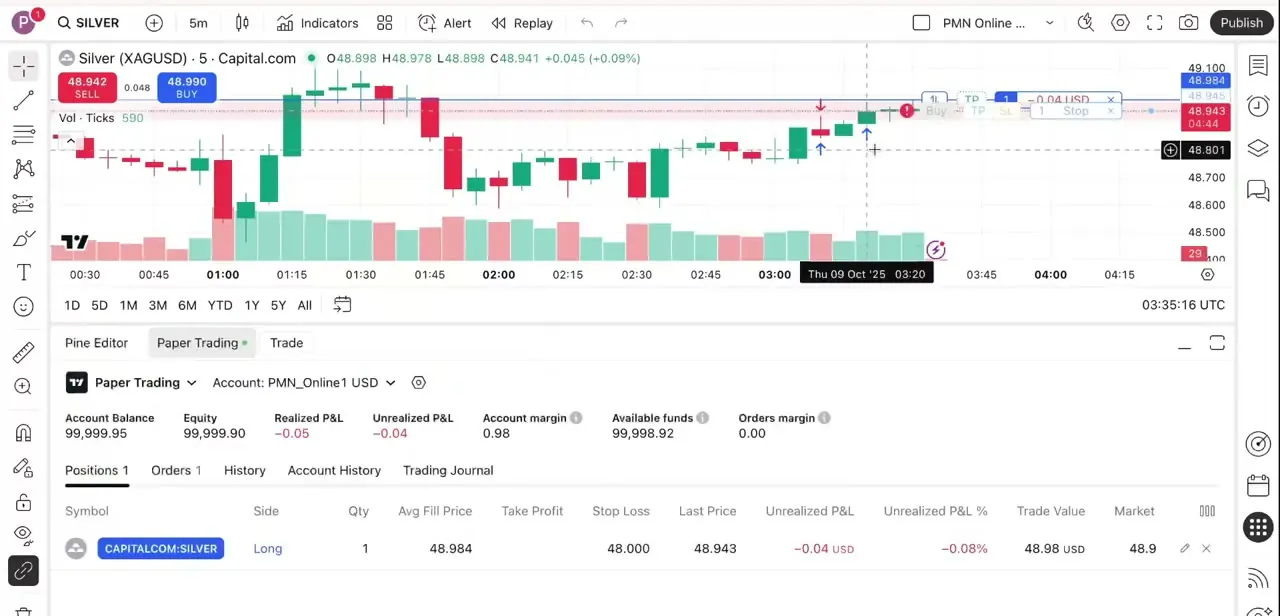
Once selected, the chart grays out everything after that point and a Replay control bar appears with play, step-forward and speed controls (Shift+Down starts or stops playback, Shift+Right steps forward one bar, if you'd rather use the keyboard). If you switch to an intraday timeframe, how far back you can go depends on your plan: TradingView's free Basic plan is not listed on their intraday-depth chart, which starts at the paid Essential tier (6 months of 1-minute data); daily and higher timeframes aren't affected by this limit.
04Step forward and place simulated trades
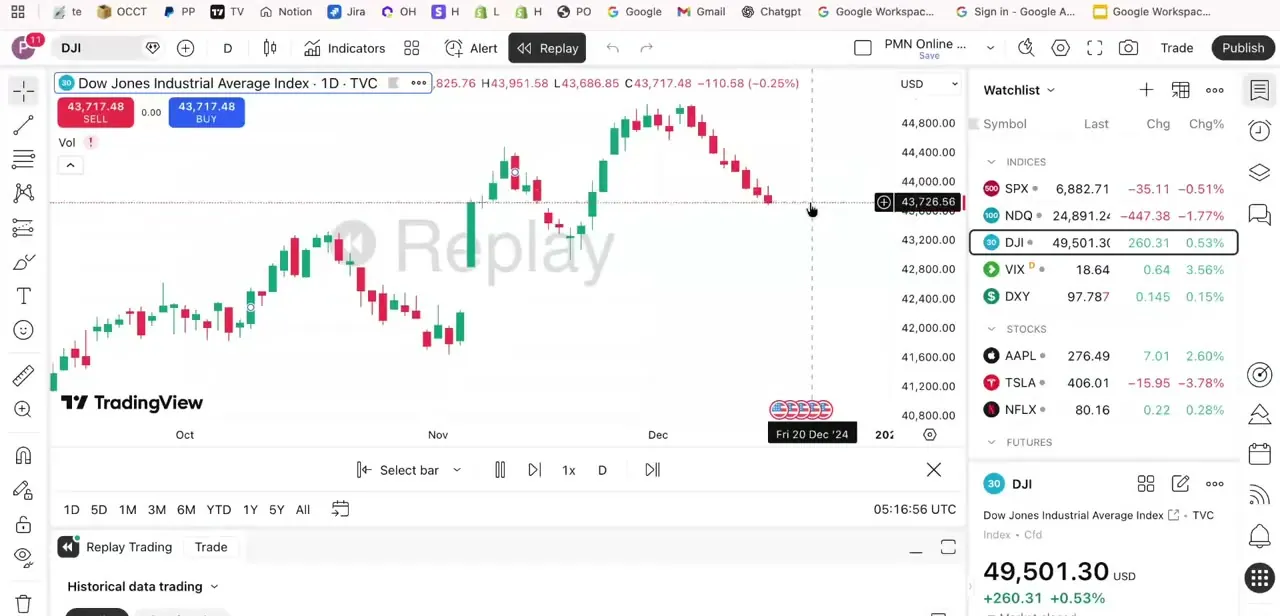
Use the step-forward button to reveal one candle at a time, and apply the same indicators and entry rules you'd use live; don't peek ahead by scrolling the chart, since that defeats the purpose. When your setup triggers, click Replay Trading to log a simulated entry, after setting your initial capital, base currency and commission size in its panel; TradingView defaults new positions to 1 unit for most symbols and 1,000 units for forex unless you change it.
Keep stepping forward to see the trade play out against your stop and target. TradingView's own documentation is explicit that this data isn't kept: "Data on trades and the overall result are available only in the session itself, and they are not saved anywhere," so anything you want to review later has to be logged outside the platform as you go.
05Track win rate and risk-reward as you go
Since Replay Trading doesn't save anything once the session ends, keep a running log outside TradingView, a spreadsheet works fine, noting entry, exit and outcome for each simulated trade. After enough trades, calculate win rate and average risk-reward ratio across the sample. A strategy needs a reasonable sample size before those numbers mean anything; five or six trades in replay isn't enough to draw conclusions from.
06Watch for the mistakes that inflate results
The most common backtesting error is unconsciously picking a starting bar because you already remember what happened next, which quietly removes the uncertainty the exercise is meant to test; using Random Bar to pick your starting point, from the previous step, removes that temptation. Also resist stopping a replay run early just because it's going well, and factor in that Replay doesn't account for slippage or fees, so real results will run somewhat worse than what the simulation shows.
| Plan | 1-minute history | 5-minute history | 15-minute history |
|---|---|---|---|
| Essential | 6 months | 30 months | 90 months |
| Plus | 1 year | 5 years | 15 years |
| Premium / Ultimate | All available history | All available history | All available history |
From TradingView's official "How much data is available for Bar Replay" page, checked September 2026. That page doesn't list the free Basic plan; daily and higher timeframes are not affected by these limits on any plan.
When it doesn't work
The Bar Replay button or toolbar doesn't appear
Why: Replay doesn't work on every chart type. TradingView excludes Renko, Kagi, Point & Figure, Range, Line Break, Volume Footprint and Time Price Opportunity charts, as well as spread and tick-based charts.
Fix: Switch to a standard candlestick, bar, area or line chart, then open Bar Replay again.
Intraday replay history looks shorter than expected on the free plan
Why: Deep intraday replay depth is gated to paid plans; TradingView's own documentation on this starts at the Essential tier.
Fix: Stick to daily or higher timeframes on the free Basic plan, or move to a paid tier if the strategy specifically needs long intraday history.
A simulated trade's results are gone after closing the tab
Why: Replay Trading data exists only for the current session and TradingView does not save it.
Fix: Log each trade's entry, exit and outcome in a spreadsheet as you go, not after the session ends.
Frequently asked questions
Can I backtest for free on TradingView without a paid subscription?
Yes. Bar Replay is available on the free Basic plan and lets you manually step through historical price data. The caveat is depth on intraday timeframes, which is capped on lower tiers; daily and higher timeframes aren't affected.
What timeframes can I backtest for free?
Daily and higher timeframes give you all of a symbol's available history on the free Basic plan. Deep intraday replay (1-minute up to 15-minute) is where paid tiers matter, starting with Essential.
Does backtesting guarantee a strategy will work in live trading?
No. Backtesting shows how a strategy would have performed historically, but live markets can behave differently, and Replay doesn't account for slippage or fees, so it's a guide, not a guarantee.
What markets can I backtest on TradingView?
The Bar Replay method works across stocks, indices, crypto and forex on any standard chart type; it doesn't support Renko, Kagi, Point & Figure, Range, Line Break, Volume Footprint or Time Price Opportunity charts.
Are my simulated Replay Trading results saved for later?
No. TradingView's documentation states trade data and results from Replay Trading exist only for that session and aren't saved anywhere, so keep your own log outside the platform.
What's the most common mistake beginners make when backtesting?
Picking a starting point because you can already see what happens next, which removes the blind, real-time uncertainty that makes a backtest meaningful. TradingView's own "Random bar" option, which picks a starting point for you, is a built-in way around it.
Sources and last check
Click paths and screenshots come from a walkthrough recorded in July 2026. The claim that Bar Replay is unrestricted on the free plan was checked against TradingView's own data-availability page in September 2026, which lists intraday depth starting at the paid Essential tier and doesn't cover Basic at all; this guide now flags that gap instead of implying full free access. The Replay Trading defaults, the unsupported chart types, the starting-bar options and the "results aren't saved" behaviour were confirmed against TradingView's own support articles at the same time.
About the author

Impran M N
I've been hooked on technology for as long as I can remember — especially the new tools and AI apps that seem to land every other week. Easy Tech Tuts is where I write up whatever I've just worked out: I do the task in the real product, record the screen, and turn it into the guide I wish I'd found first.