Easy Tech Tuts
How To Remove Buy And Sell Arrows & Buttons in TradingView 2026 Easily
By Impran M N
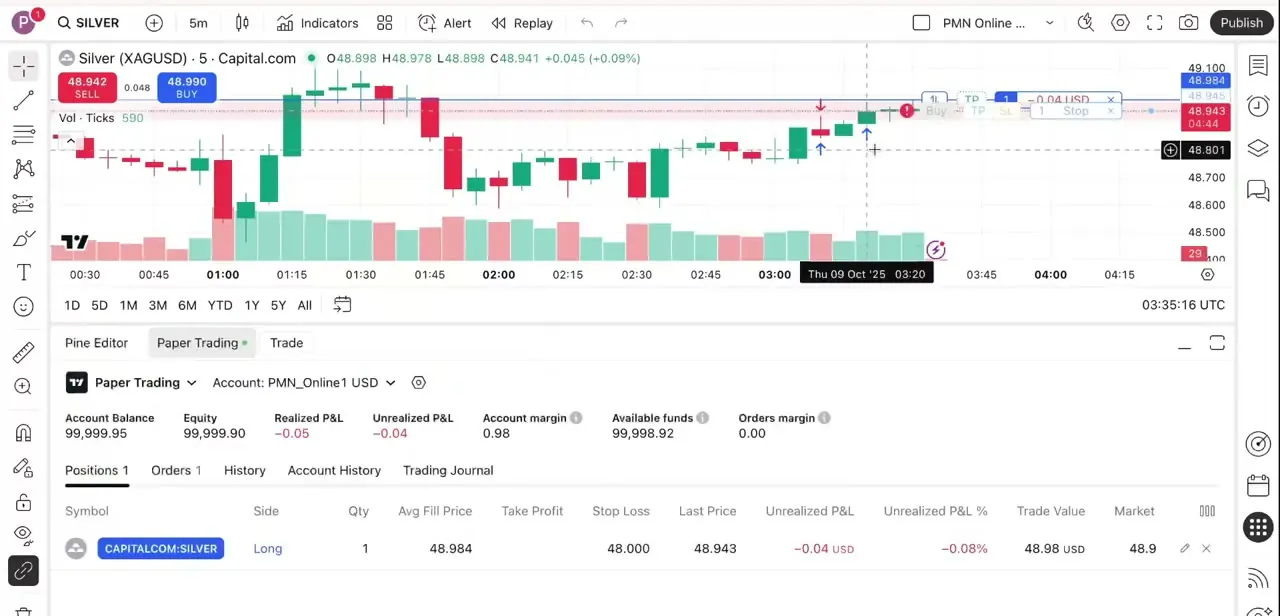
Two separate things get called "buy and sell arrows" on TradingView, and they're turned off in different places. Execution marks are the small chevrons that show where your past trades filled; the Buy/Sell buttons are the floating order-placement controls that let you trade straight off the chart. This guide covers what each one looks like, then walks through the settings menu for both, so you can get to a cleaner view for technical analysis without losing your actual trade history or accidentally leaving one-click order buttons active.
01Spot the execution arrows on your chart
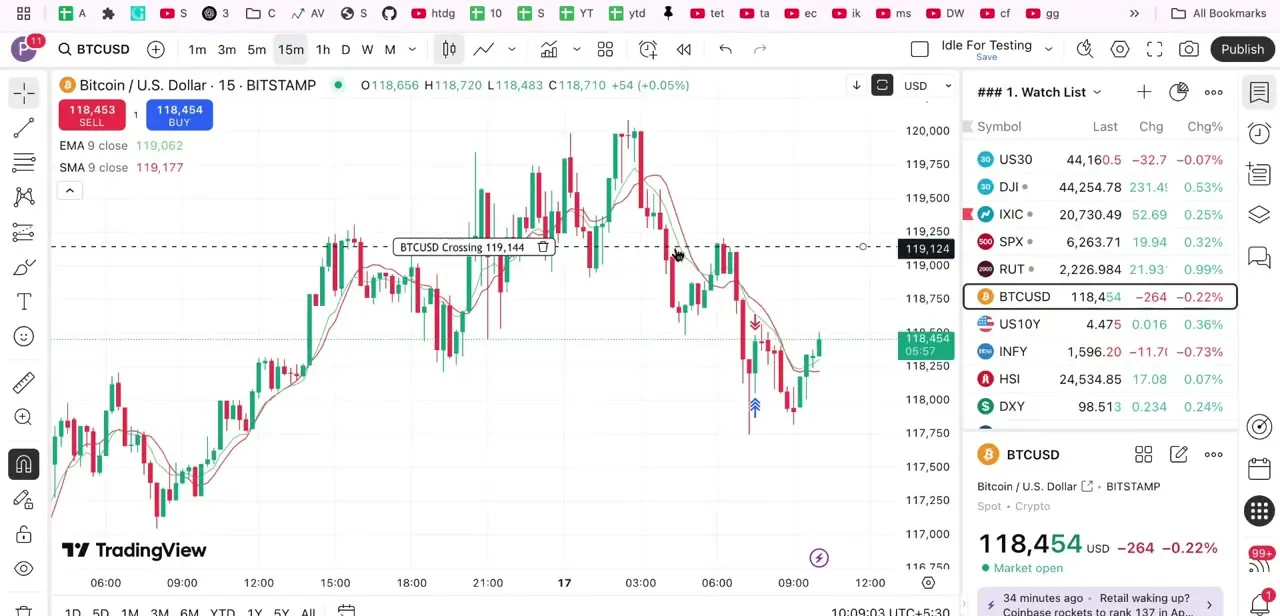
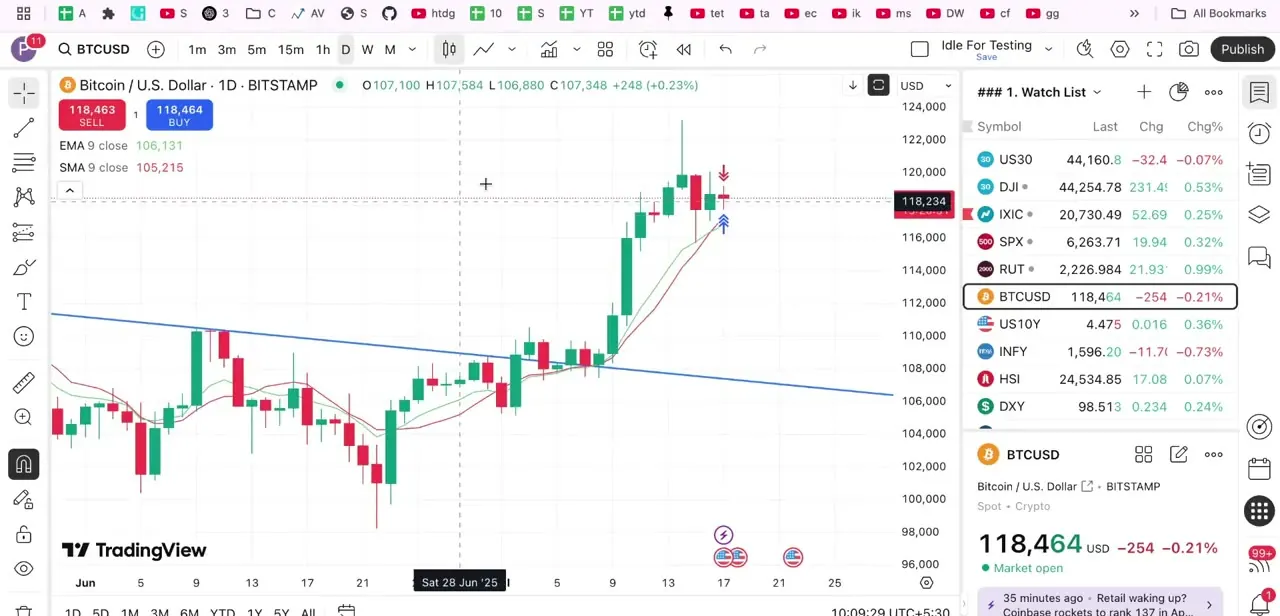
On a BTCUSD chart with trade history, small chevron-style arrows sit near recent price action, sometimes paired with quantity labels like "7 @ 118122" marking the price and size of each executed order. TradingView colors these by side: blue for executed buys, red for executed sells. They render directly on top of candles and moving averages, which is why they start to feel like clutter once several show up close together.
02See how labels stack up over time
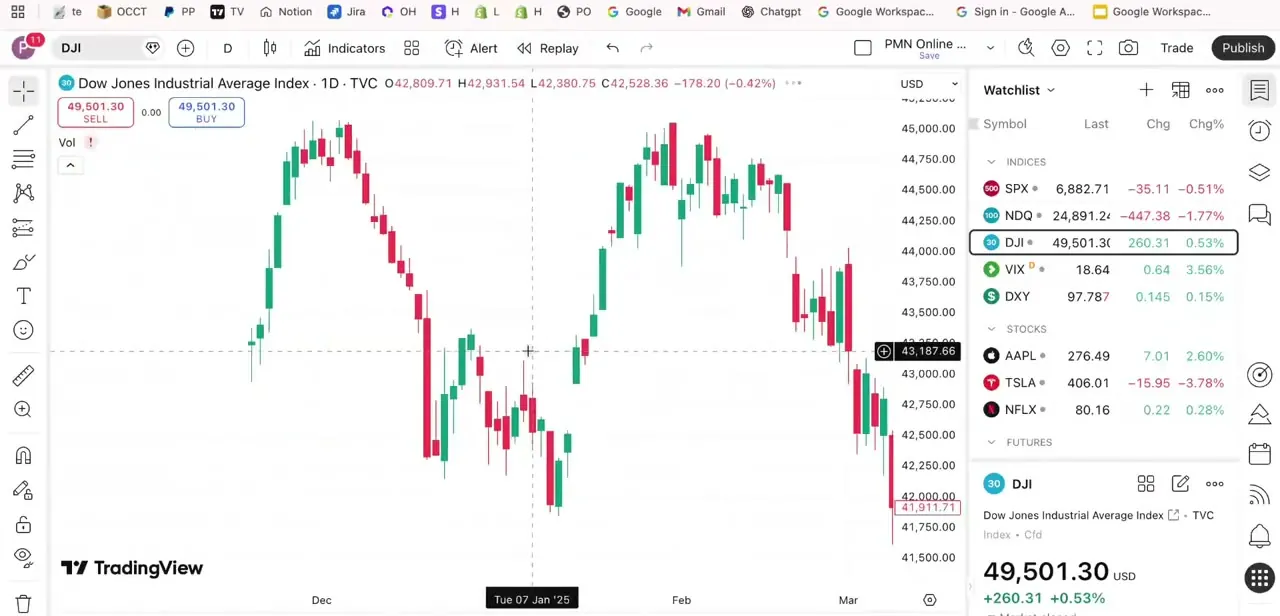
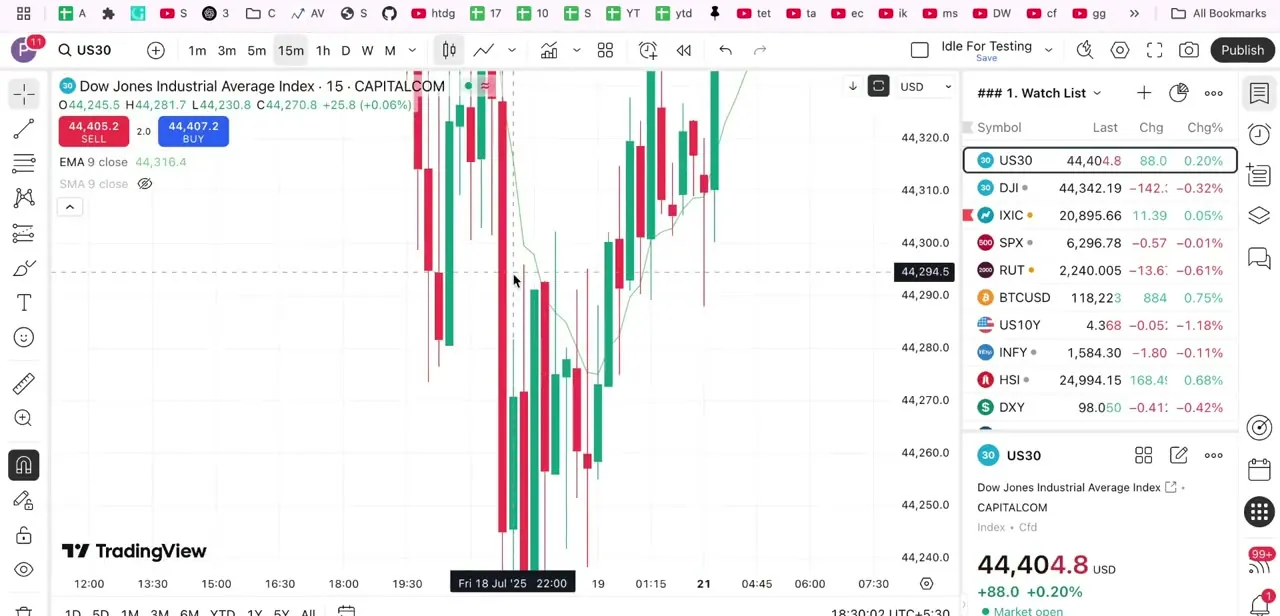
On a daily chart covering a longer trade history, a red sell arrow and a blue buy arrow can appear together with their price and quantity labels layered above the candles. The more trades you log, the more these accumulate; TradingView groups marks automatically once there are many on the same area, but on a shorter timeframe or a smaller chart window they can still overlap the price action you're trying to read.
03Open your chart settings
With your chart open, click the gear icon on the chart's toolbar (or the "..." menu near the symbol name) to bring up the settings window. This is the same panel that controls indicators, gridlines and other visual elements, useful to know for other cleanup tasks too.
04Go to the Trading tab
Inside settings, open the Trading tab. It's split into two sections that matter here: Appearance, which controls how past trades render on the chart, and General, which controls the buttons used to place new orders. The arrows and the order buttons are separate settings in separate sections, which is why turning one off doesn't touch the other.
05Turn off the execution arrows and labels
In the Trading tab's Appearance section, uncheck Executions and Execution labels. Executions controls the blue and red arrows themselves; Execution labels controls the price and quantity text near the price scale.
Both are checked by default, which is why they show up automatically once you have trade history on that symbol. Unchecking them only controls the visual markers, not your actual order data.
06Turn off the Buy/Sell order buttons, if those are what's cluttering the chart
If it's the floating Buy and Sell buttons you want gone, not the trade-history arrows, that's a different toggle: still in the Trading tab, but under General, not Appearance. Unchecking it removes the one-click order buttons from the chart entirely.
A faster route to the same setting is right-clicking any item in the chart's legend and toggling it from there. On the TradingView mobile app, the equivalent control is called one-tap trading: turning it off hides the floating Buy/Sell panel and replaces it with a single Trade button that opens the full order ticket instead.
07Confirm the change
Click OK to save. Whichever combination you unchecked, the change applies to the chart immediately, leaving just your candles and any indicators you've added. Your trade history and any open orders are untouched; these settings only affect what renders on the chart.
| Feature | What it shows | Where to turn it off |
|---|---|---|
| Executions | Blue/red arrows marking where past trades filled | Settings > Trading > Appearance |
| Execution labels | Price and quantity text next to each execution arrow | Settings > Trading > Appearance |
| Buy/Sell buttons | Floating buttons for placing new orders at market price | Settings > Trading > General (or the chart legend's right-click menu) |
When it doesn't work
Arrows are still on the chart after unchecking Executions
Why: The arrows may be coming from an indicator or script added to the chart, not from TradingView's native execution marks.
Fix: Check the indicators list for a buy/sell-arrow script; remove it or look for its own show/hide toggle, separate from the Trading tab setting.
The Buy/Sell buttons are still visible after turning off Executions
Why: Executions and Buy/Sell buttons are separate settings, in Appearance and General respectively, under the same Trading tab.
Fix: Uncheck the Buy/Sell buttons option under Trading > General, or right-click a chart legend item and toggle it off from there.
Can't find a Buy/Sell button toggle in the mobile app
Why: On mobile, the same control is named one-tap trading, not Buy/Sell buttons.
Fix: Turn off one-tap trading in the app's trading settings; the floating panel is replaced by a single Trade button that opens the order ticket.
Frequently asked questions
Where do I find the option to remove buy and sell arrows on TradingView?
In chart settings, under the Trading tab's Appearance section: the Executions and Execution labels checkboxes.
What's the difference between execution arrows and the Buy/Sell buttons?
Execution arrows mark where past trades already filled, colored blue for buys and red for sells. Buy/Sell buttons are separate, floating controls for placing new orders directly from the chart. They're turned off in different sections of the same Trading tab.
Will removing the arrows delete my trade history?
No. Unchecking Executions only hides the visual markers on the chart; it doesn't affect your actual trade records or account history.
Does this work on TradingView mobile as well as desktop?
The execution-arrow toggle isn't documented separately for mobile. The Buy/Sell buttons equivalent is called one-tap trading; turning it off hides the floating buttons and shows a single Trade button instead.
Are the execution arrows different colors for buys and sells?
Yes. TradingView renders executed buy orders as blue arrows and executed sell orders as red arrows.
Can I turn the arrows or buttons back on later if I change my mind?
Yes. Revisit the Trading tab in chart settings and recheck Executions and Execution labels for the arrows, or the Buy/Sell buttons option under General for the order buttons.
Sources and last check
Click paths and screenshots come from a walkthrough recorded in July 2026. The earlier draft covered only the execution arrows despite the title also naming "buttons"; a dedicated step and settings table for the Buy/Sell order-placement buttons, a separate control under Trading > General, not Appearance, were added and checked against TradingView's own Supercharts and Buy/Sell button support pages in September 2026. The blue-buy/red-sell color distinction and the mobile one-tap trading behaviour were confirmed against TradingView's Execution marks and mobile Buy/Sell button pages at the same time.
About the author

Impran M N
I've been hooked on technology for as long as I can remember — especially the new tools and AI apps that seem to land every other week. Easy Tech Tuts is where I write up whatever I've just worked out: I do the task in the real product, record the screen, and turn it into the guide I wish I'd found first.