Easy Tech Tuts
How to Set 20 EMA in TradingView Easily 2026
By Impran M N
The 20 EMA is a favorite among short-term traders for spotting trend direction and pullback entries, but getting it configured correctly — and reading it right once it's on the chart — matters more than most beginners expect. This guide covers how to find the exponential moving average in TradingView's indicator search, set its length to 20, and understand what the resulting line is actually telling you. It's built for scalpers, intraday traders, and anyone using moving averages for the first time.
01Open the Indicators panel and search
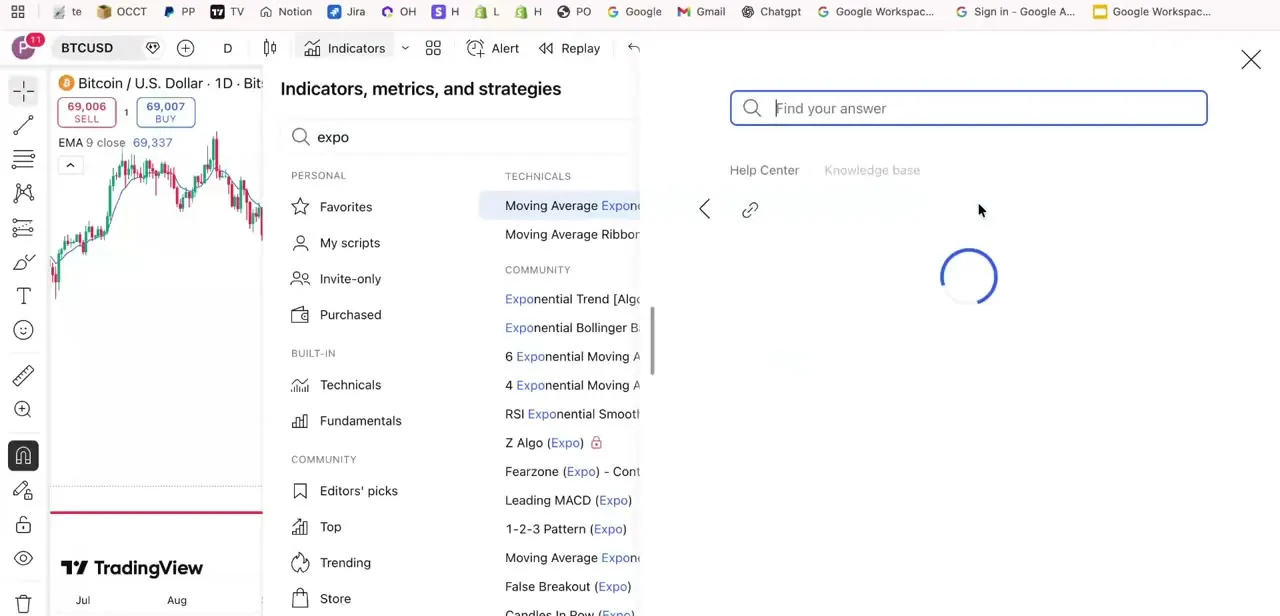
Click Indicators in the top toolbar of any TradingView chart, then type a partial word like 'expo' into the search box rather than the full name — TradingView's search matches on substrings, so 'expo' is enough to surface every exponential-based indicator. Under the Technicals section, 'Moving Average Exponential' is the one you want; TradingView also ships a plain 'Moving Average' (simple) and several variants like Ribbon or Weighted, so it's worth reading the full name before clicking rather than grabbing the first result.
02Add the indicator and confirm it's exponential
Clicking Moving Average Exponential drops it onto your chart immediately with a default length, and a small label in the top-left of the price pane confirms what's active — something like 'EMA 9 close' followed by the current value. That label is your quickest sanity check that you added the exponential version and not the simple moving average, since the two look nearly identical as a plotted line but behave differently in how they weight recent price.
03Open settings and change the length to 20
Click the indicator's name where it appears on the chart, or the small gear icon next to it, to open its settings. The Length field controls the period — change it from the default to 20 and confirm. The on-chart label updates immediately to reflect the new setting, so you can verify the change without reopening the settings panel every time.
04Read the 20 EMA label on your chart
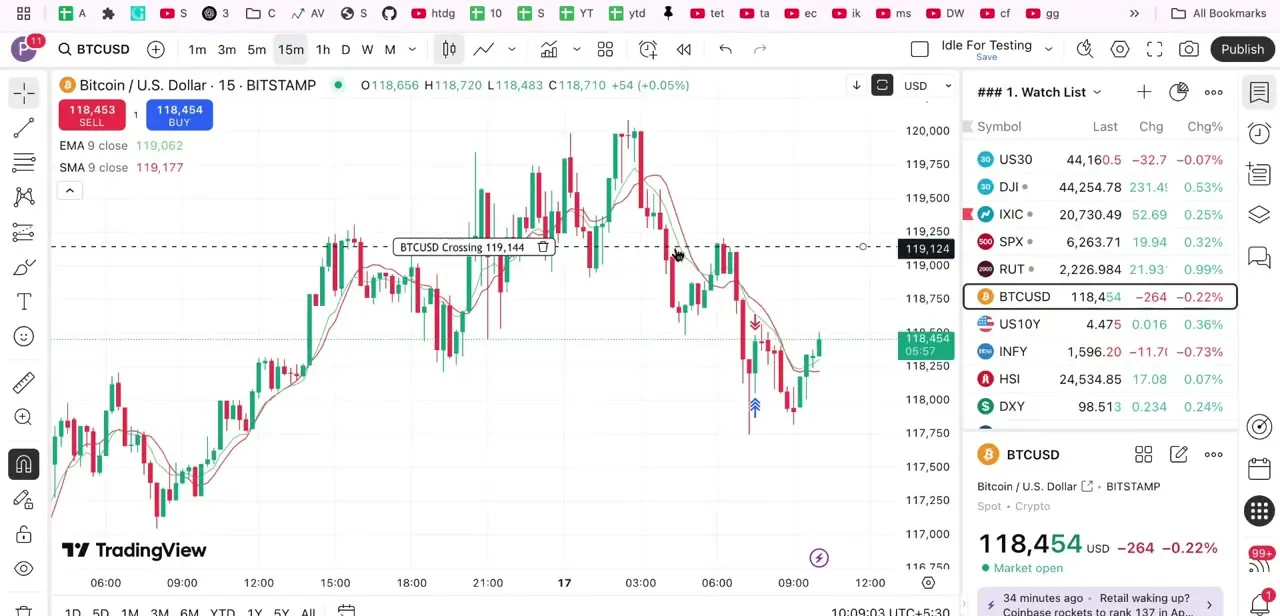
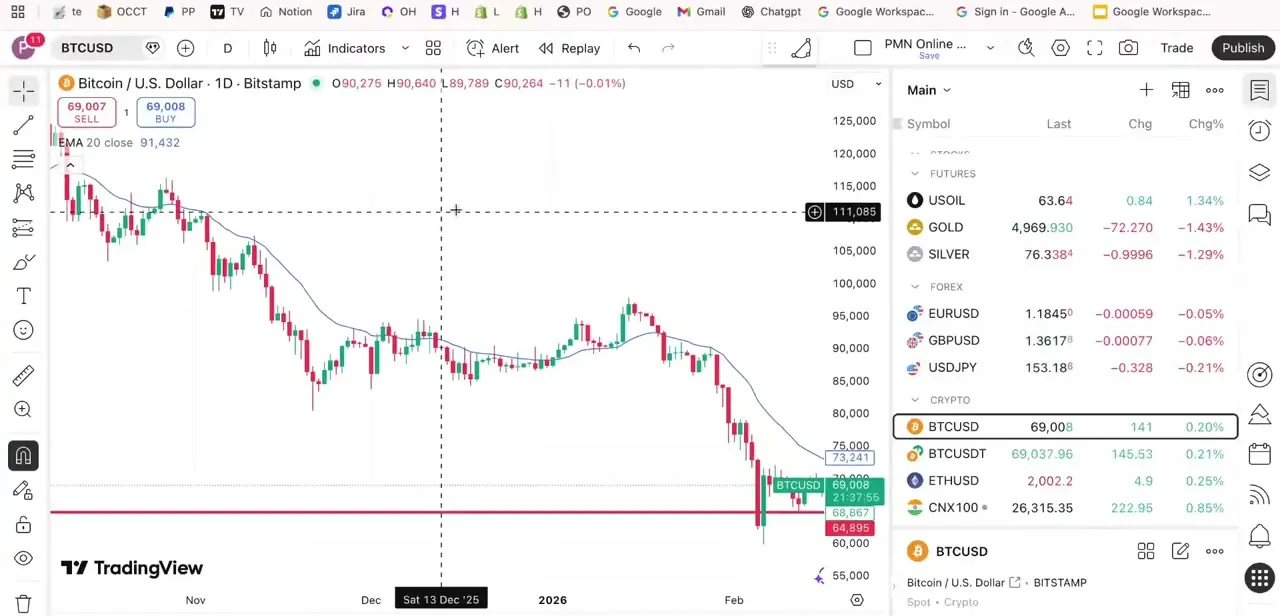
Once set, the label reads something like 'EMA 20 close' followed by the live value, and the plotted line itself hugs price more tightly than a longer-period average would, reacting faster to recent candles. This is the whole point of using a shorter EMA for short-term work: it tracks the last 20 periods with recent price weighted more heavily, so it turns and reacts closer to real time than a 50 or 200 period average ever would.
05Use it for trend direction and pullback entries
With the 20 EMA live, the most common read is simple: price consistently holding above the line suggests a short-term uptrend, and pullbacks that touch the EMA without closing decisively below it are the entries many intraday and swing traders watch for. The reverse applies in a downtrend, where the EMA acts as resistance on bounces rather than support on pullbacks.
06Avoid the common mistakes
The biggest one is trading the EMA in isolation — a single moving average tells you where price has been relative to itself, not where it's going, so pair it with price action, volume, or a second indicator for confirmation before entering. The second is applying a 20-period setting meant for short-term charts to a much higher timeframe and expecting the same pullback behavior; the same length behaves very differently on a 5-minute chart versus a weekly one.
Frequently asked questions
How is the 20 EMA different from the 20 SMA?
The EMA weights recent price data more heavily than older data, so it reacts faster to price changes and hugs price more closely than a simple moving average of the same length.
What timeframes work best with the 20 EMA?
It's most commonly used on shorter timeframes for intraday and scalping strategies, though the same setting can be applied to any timeframe depending on your trading style.
How do I make sure I added the exponential version and not the simple moving average?
Check the label in the top-left of the chart after adding it — it should read 'EMA' followed by the period, not 'MA' or 'SMA', confirming you picked Moving Average Exponential rather than the plain Moving Average.
Is the 20 EMA a standalone trading strategy?
No, most traders use the 20 EMA alongside other tools like price action or additional indicators rather than relying on it in isolation.
About the author

Impran M N
I've been hooked on technology for as long as I can remember — especially the new tools and AI apps that seem to land every other week. Easy Tech Tuts is where I write up whatever I've just worked out: I do the task in the real product, record the screen, and turn it into the guide I wish I'd found first.