Easy Tech Tuts
How to see Heatmap in TradingView, Find & Get Heatmaps Easily 2026
By Impran M N
The TradingView Heatmap turns hundreds of tickers into a single color-coded grid, so you can tell which sectors or coins are moving without scanning a list one row at a time. This guide shows exactly where the Heatmap lives in TradingView's menu, what a real Stock Heatmap and Crypto Coins Heatmap look like once you open them, and how to read the size and color of each box. It also covers switching asset classes, drilling into a single sector, and where the Heatmap fits next to TradingView's other market tools.
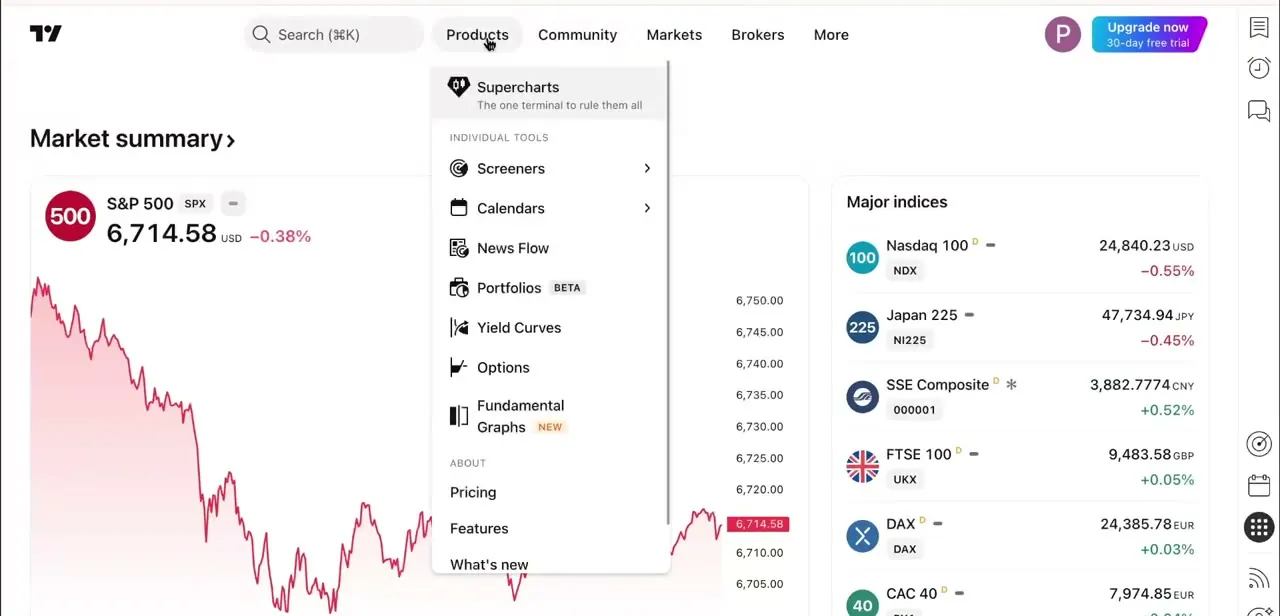
01Open Products > Screeners > Heatmaps
From the TradingView homepage, click Products in the top navigation bar, not Markets. TradingView's own documentation lists the Heatmap under Products > Screeners > Heatmaps, not as its own top-level entry: hover or click into Screeners from the Products menu, then pick the heatmap type, Stocks, ETFs, or Crypto Coins. Supercharts sits at the top of the Products menu as the main charting terminal, but for a market-wide visual overview, the Heatmap is the one you want.
02Read the Stock Heatmap
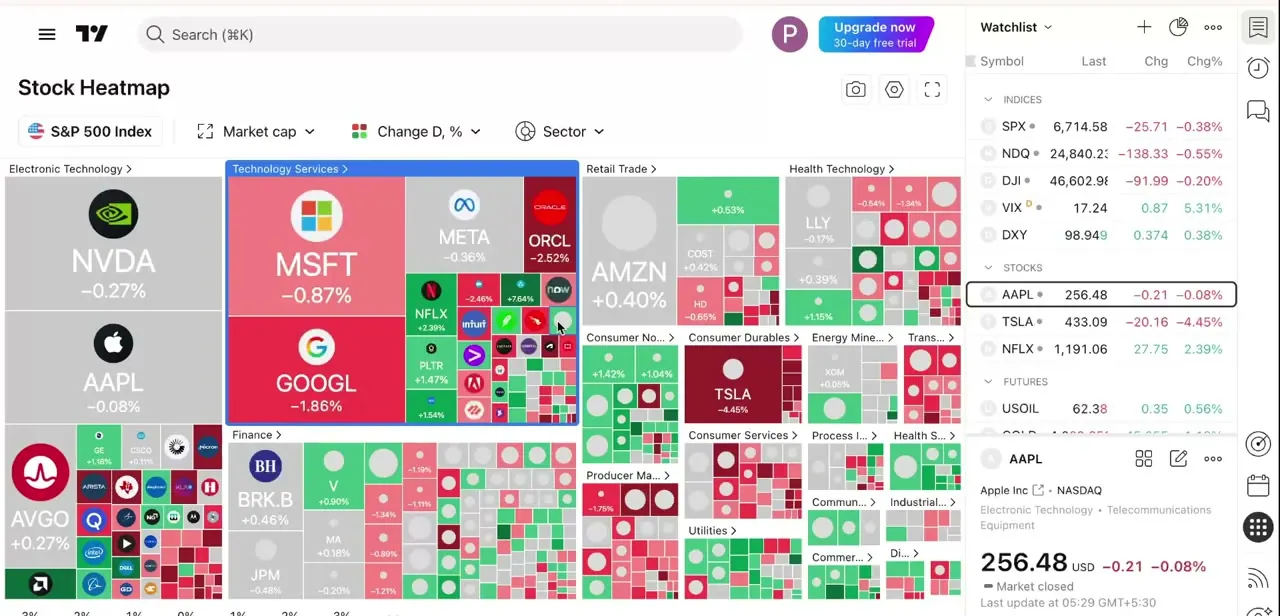
Opening the Stocks heatmap lands you on the Stock Heatmap, defaulted here to the S&P 500 Index. The whole screen is a grid of colored rectangles grouped into labeled sectors, Electronic Technology, Technology Services, Retail Trade, Health Technology, Finance, and more, with each rectangle's size representing that company's relative market cap and its color showing daily performance: red for down, green for up.
Individual names like NVDA, AAPL, MSFT, META, and TSLA are large enough to read directly because they dominate their sectors by size; smaller constituents cluster into tighter grids within the same block. Clicking a sector's name opens a zoomed-in heatmap containing only the symbols in that group, useful once a sector-wide color catches your eye and you want to see which individual names are driving it.
03Change what size and color represent
Above the grid sit an index selector (S&P 500 Index by default, swappable for other indices), a Size by control, and a Color by control. What each one offers depends on the asset class you're viewing, since not every metric applies to every market.
04Switch to the Crypto Coins Heatmap
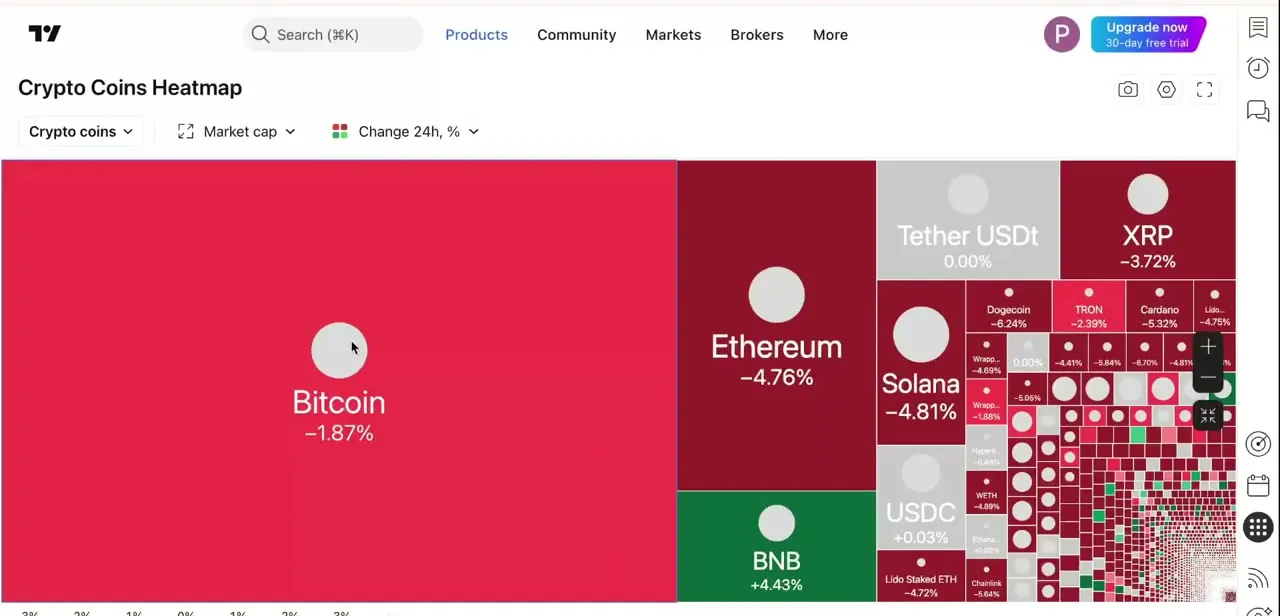
The same tool works for crypto: switching the asset class swaps the entire grid to Bitcoin, Ethereum, Solana, XRP, and the rest of the top coins by market cap, using the same size-by-cap, color-by-change logic, with its own set of Size by and Color by options. In this view Bitcoin and Ethereum dominate the layout as expected, while smaller-cap coins compress into a dense grid in the corner, exactly the kind of at-a-glance scan that's tedious to do from a sorted table.
05Know when to reach for the Screener, and where to find the Heatmap on mobile
The Heatmap is built for pattern-spotting, not precision. It tells you at a glance that Technology Services is red today, but it won't hand you exact volume, P/E ratios, or custom multi-condition filters the way the Screener does.
Reach for the Heatmap first to spot where the action is, then switch to the Screener to filter that sector or asset class down to a specific list you can act on: the two are sequential steps, not competing tools. On the TradingView mobile app, the Stock and Crypto Coins heatmaps sit in the app's More menu in the bottom right.
The Forex and ETF heatmaps aren't in that app menu; open them in the mobile browser instead. All of it works on a free account, with no paid plan required for the core view.
| Asset class | Size by options | Color by options |
|---|---|---|
| Stocks | Market cap, Volume, Turnover, Mono size | Change, Performance, Volatility, Gap |
| ETFs | AUM, Volume, Turnover, Mono size | Change, Performance, Volatility, Gap |
| Crypto Coins | Market cap, Fully diluted market cap, Volume in USD, Mono size | Change, Performance, Volatility, Gap |
Exact option labels per TradingView's Heatmap documentation; the specific Change/Performance windows available (daily, weekly, monthly, etc.) vary by asset class.
Frequently asked questions
Where is the Heatmap feature in TradingView?
Open the Products menu in the top navigation, go into Screeners, then pick Heatmaps and choose Stocks, ETFs, or Crypto Coins. It isn't a standalone top-level item next to Screeners; it's nested inside it.
What's the difference between the Heatmap and the Screener?
The Heatmap gives a quick color-coded visual of performance by sector or asset. The Screener offers detailed, filterable data in list form. Use the Heatmap to spot where to look, then the Screener to dig into specifics.
Do I need a paid plan to use the Heatmap?
No. TradingView's documentation doesn't restrict any Heatmap type to paid plans, and data updates in real time even on a free account.
Is the Heatmap available on mobile?
The Stock and Crypto Coins heatmaps are in the TradingView mobile app's More menu. The Forex and ETF heatmaps aren't in the app menu; you'd need the mobile browser for those.
Sources and last check
Click path and screens come from a walkthrough recorded in 2026. The menu path was re-checked against TradingView's official Heatmap documentation in September 2026, which places Heatmaps inside Products > Screeners, not as a standalone item under Individual Tools; this guide previously implied the latter, and the step is corrected here. The Size by/Color by options table and the free-tier access claim were also checked against that page.
About the author

Impran M N
I've been hooked on technology for as long as I can remember — especially the new tools and AI apps that seem to land every other week. Easy Tech Tuts is where I write up whatever I've just worked out: I do the task in the real product, record the screen, and turn it into the guide I wish I'd found first.