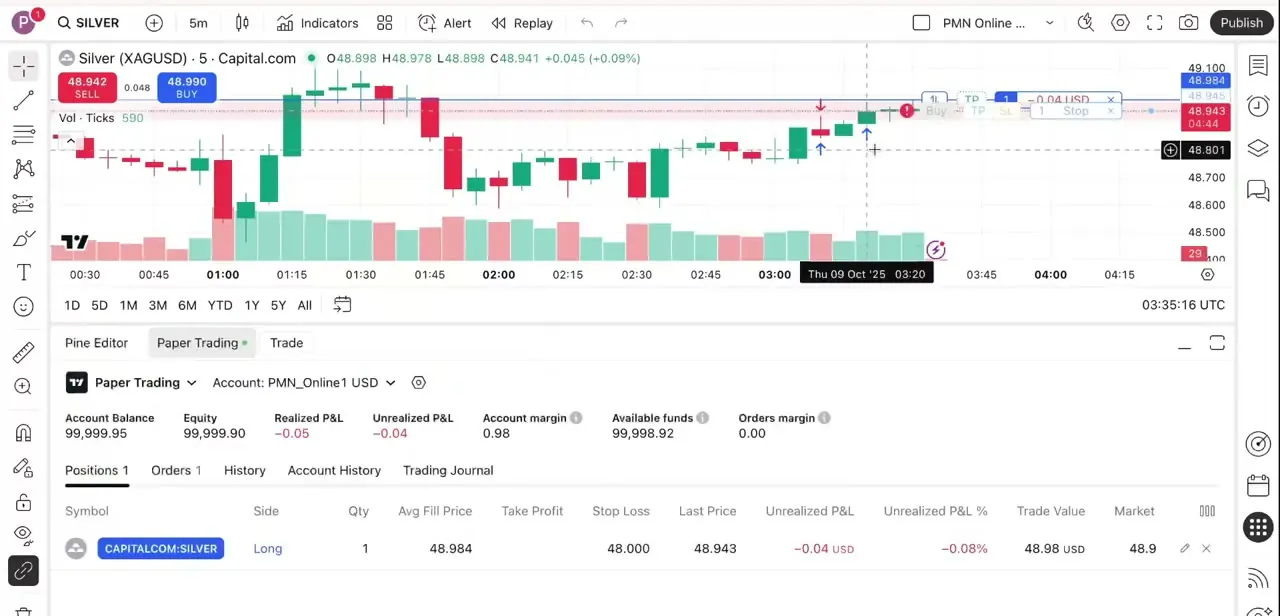
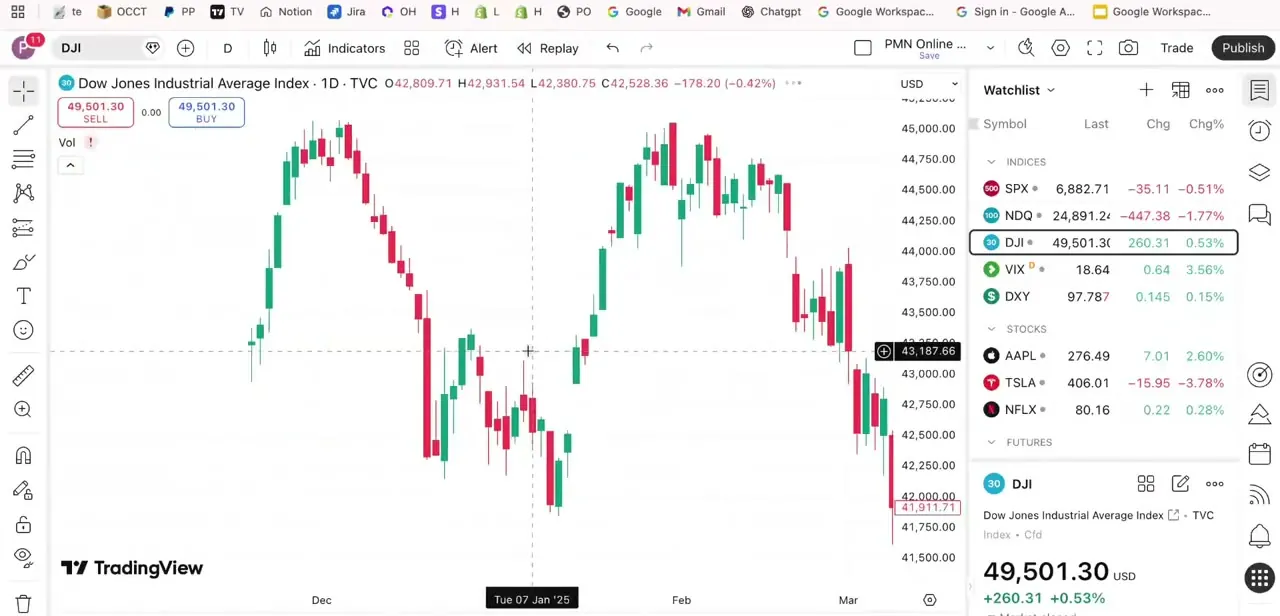
Easy Tech Tuts
How to Get Back Disappeared Candles on Tradingview, Unhide Candlesticks Easily 2026
By Impran M N
If your candlesticks seem to have disappeared from a TradingView chart, it's rarely a technical glitch. The most common cause is the symbol's visibility getting switched off by an accidental click, but TradingView's own troubleshooting notes list a few other places to check too: the chart type, the Symbol style settings, and the price scale's autoscale setting. This guide starts with the right-click toggle, since it accounts for most cases, then works through the less common causes and how to rule each one out.
01Recognize the symptom
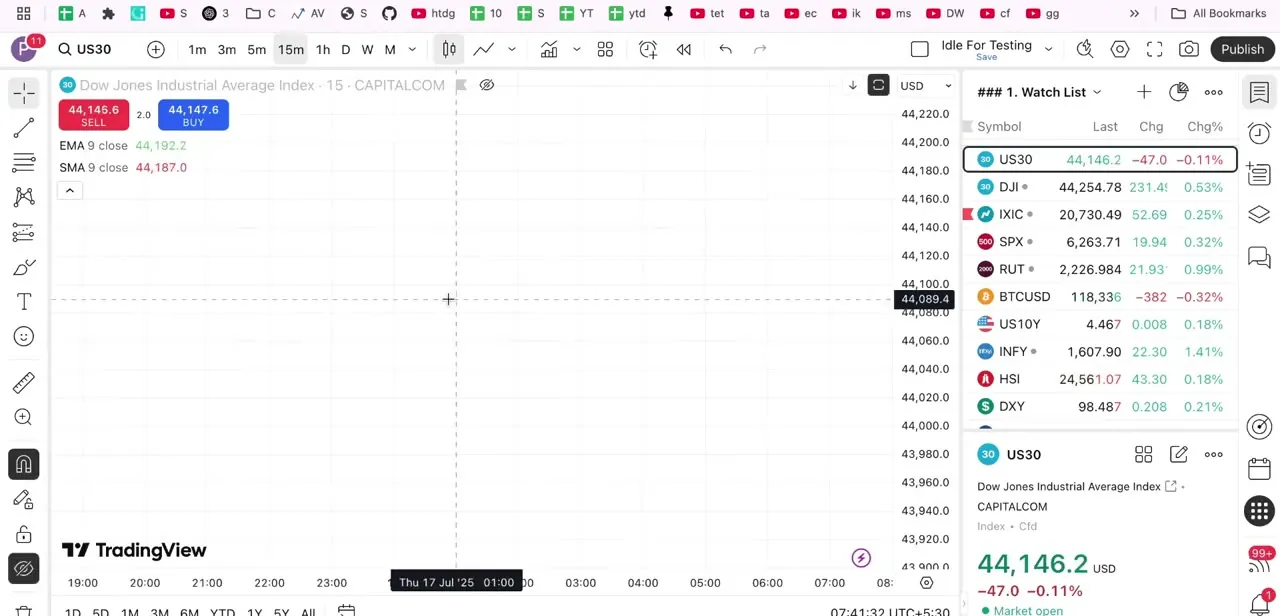
When this happens, the chart itself still loads normally. The price scale, time axis, watchlist, and toolbar all behave as expected.
Only the plot area where candlesticks should be is completely blank, aside from your crosshair. It's easy to assume something is broken or that the data feed dropped, but if everything else on the page is responding normally, the data is still there. It's just been told not to draw.
02Right-click the symbol to find Hide
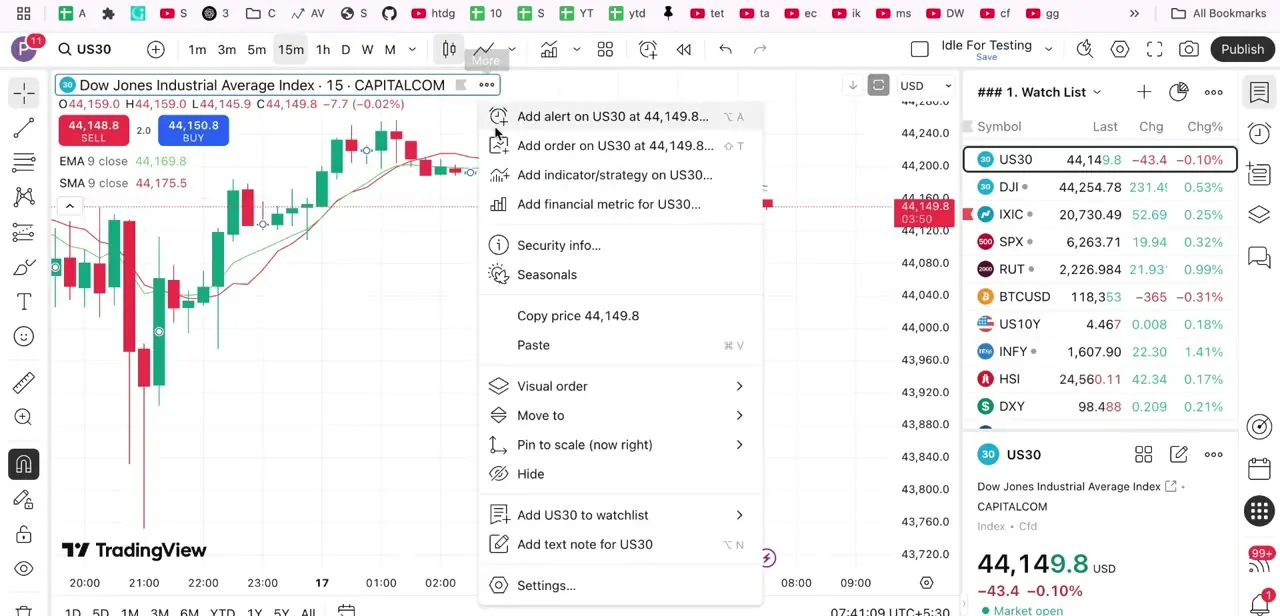
Right-click directly on the symbol's name or price legend in the top-left corner of the chart. This opens a long context menu: Add alert, Add order, Add indicator/strategy, Add financial metric, Security info, Seasonals, Copy price, Visual order, Move to, Pin to scale, and further down, Hide.
That Hide entry is the visibility toggle for the symbol's plot. It's the one that switches off silently when it gets clicked by accident, often while aiming for a neighboring row like Pin to scale or Settings.
03Toggle it back on
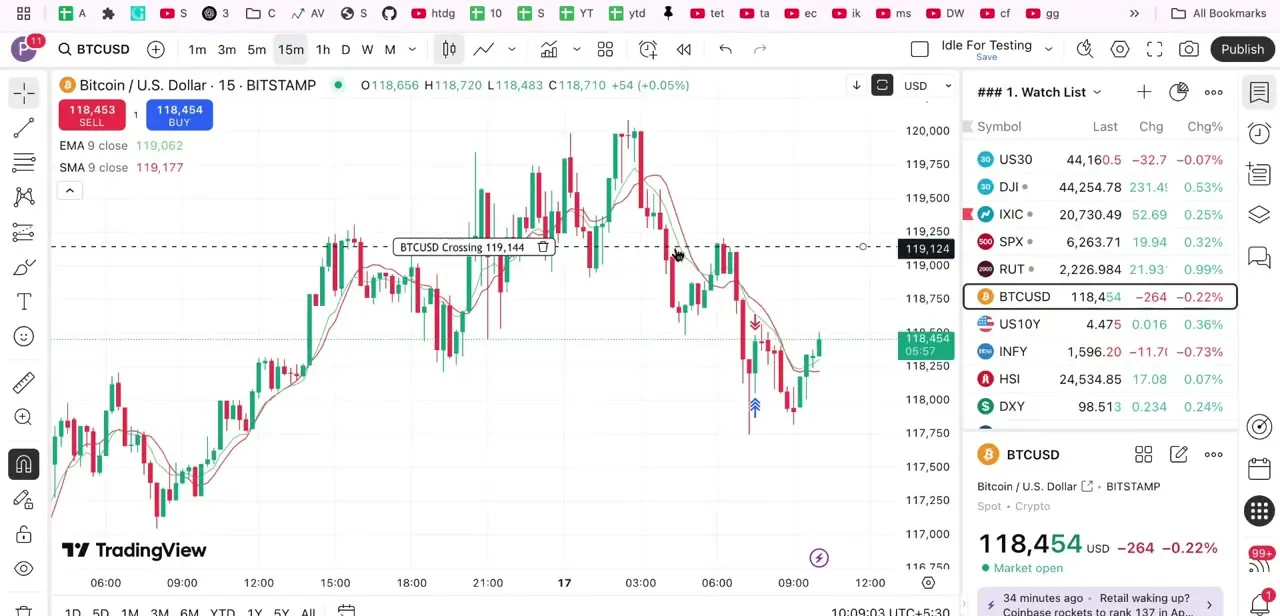
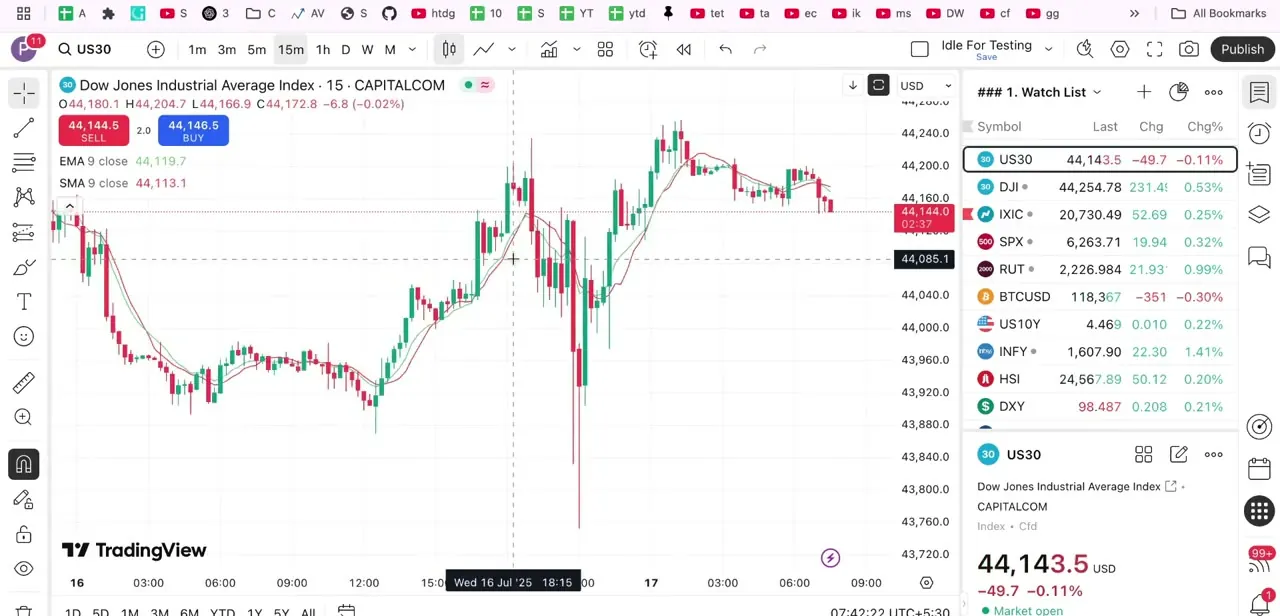
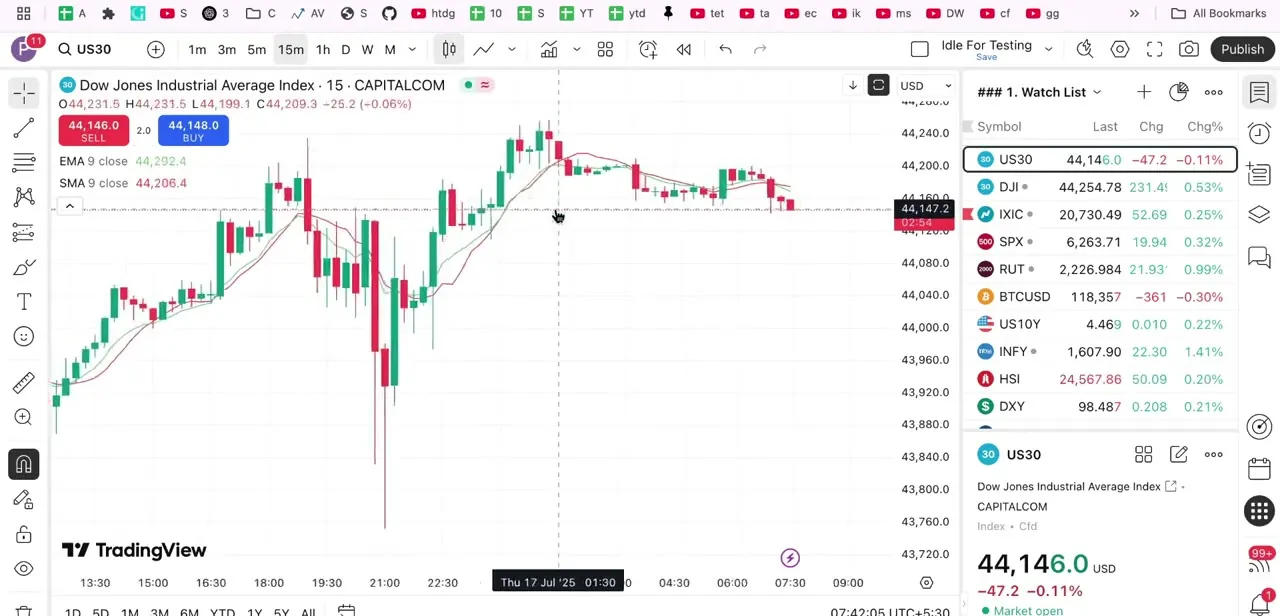
If the menu shows the symbol as currently hidden, selecting the same option again restores it. The candlesticks reappear instantly along with any moving averages plotted on the same pane. In the frames here that's a 9-period EMA and SMA layered over the candles, confirming that nothing about the indicator setup was lost, only the candle visibility itself.
04If Hide wasn't the cause, check three more settings
TradingView's own troubleshooting notes for this exact symptom point to three other places. First, confirm the chart type is still set to Candles: switching to Line, Area, or another type replaces the candles without touching the Hide toggle at all.
Second, right-click the chart, open Settings, and go to the Symbol tab. Check that Body, Border and Wick are all ticked, with a color that stands out from your chart background; a candle color that matches the background is technically drawn but invisible.
Third, check autoscale. If it's off and the price scale is stuck on an old range, candles can flatten into an unreadable sliver at the top or bottom of the pane instead of disappearing outright.
05Still blank? Use the Object Tree and Data Window
Click Object Tree and Data Window on the right-side toolbar, or press Ctrl+Shift+O (Cmd+Shift+O on a Mac), and use it to hide, show, or remove drawings, indicators and symbols directly instead of guessing from the right-click menu. It also lists every plotted element individually, which is where you'd catch a full-pane indicator or an active Replay session sitting on top of the price plot and blocking it from view.
06Avoid triggering it again
Because Hide sits in the same right-click menu as several frequently used actions, it's easy to slow down slightly when right-clicking near the symbol legend, especially on a laptop trackpad where a slightly-off click can land on the wrong row. If you rely on a specific chart layout daily, save it once everything is confirmed visible, so a stray click during a session doesn't carry over the next time you open TradingView.
When it doesn't work
Selecting Hide again does nothing
Why: The chart type was switched away from Candles (to Line, Area, or similar) instead of the main series being hidden.
Fix: Open the chart type dropdown next to the timeframe selector and switch it back to Candles.
Hide is off and the chart type is Candles, but the plot is still empty
Why: The Symbol style settings for Body, Border or Wick are unticked, or set to a color that matches your chart background.
Fix: Right-click the chart, open Settings, go to the Symbol tab, and tick Body, Border and Wick with a color that stands out from the background.
Candles look squashed into a flat line at the edge of the pane
Why: Autoscale is off and the price scale is stuck on an old range.
Fix: Enable autoscale on the price scale so TradingView refits the visible range to the current data.
None of the above explains it
Why: A full-pane indicator or an active Replay session is sitting over the price plot.
Fix: Exit Replay mode if it's running, and use the Object Tree and Data Window to check what else is drawn on the same pane.
Frequently asked questions
Why did my candles disappear on TradingView?
Most often because the symbol's visibility got switched off by an accidental click. TradingView's own troubleshooting guidance lists two other common causes too: the chart type getting changed away from Candles, and the Symbol style settings (Body, Border, Wick) being unticked or colored to match the background.
How do I get my candles back?
Right-click the symbol's name in the top-left legend and select Hide again to toggle visibility back on. If Hide is already off, check the chart type and the Symbol style settings next.
Where is the Hide option located?
In the context menu you get from right-clicking the symbol name or price legend at the top-left of the chart. It's listed below Pin to scale and above Add to watchlist.
Does toggling visibility affect my indicators or drawings?
No. Toggling the symbol's visibility only affects whether the candlesticks are drawn. Moving averages and other indicators on the same pane are unaffected and reappear right along with the candles.
I checked Hide and it's already off. What next?
Confirm the chart type is set to Candles, then open Settings, go to the Symbol tab, and check that Body, Border and Wick are all ticked with a color that contrasts against your background. If the price scale looks stuck, enable autoscale too.
What if none of that works?
Open the Object Tree and Data Window from the right toolbar and check the symbol's listed visibility state directly. This is also where you'd catch a Replay session or a full-pane indicator sitting over the candles.
Sources and last check
Click path and screenshots come from a screen recording; the right-click menu and the Hide item are visible directly in the captured frames. The list of causes was checked in September 2026 against TradingView's official support articles 'Candles have disappeared from the chart,' 'How to restore hidden drawings/indicators/charts,' and 'How to show Hide, Settings and Remove options of an indicator or ticker symbol.' The original draft covered only the Hide toggle; the chart-type, Symbol-style, and autoscale causes were added from those articles, and the Object Tree step was corrected to match the documented access method (right toolbar, or Ctrl+Shift+O / Cmd+Shift+O).
About the author

Impran M N
I've been hooked on technology for as long as I can remember — especially the new tools and AI apps that seem to land every other week. Easy Tech Tuts is where I write up whatever I've just worked out: I do the task in the real product, record the screen, and turn it into the guide I wish I'd found first.