Easy Tech Tuts
How to Find 52 Week High Stocks in TradingView Easily 2026
By Impran M N
Finding stocks that are pushing to new yearly highs is much faster with TradingView's built-in Stock Screener than checking charts one by one. A 52-week high often signals real buying strength, and the Screener lets you surface every stock hitting one right now instead of relying on a scattered watchlist or news headlines. This guide walks through opening the Screener, applying the exact filter that isolates 52-week highs, and layering on volume and market cap so the list stays focused on stocks you can actually trade.
01Understand what a 52-week high actually means
A 52-week high is the highest price a stock has traded at over the past year. Traders watch this level because pushing through it, or trading near it, often reflects sustained buying interest rather than a one-day spike — institutions and momentum traders both pay attention when a name breaks into new territory with no overhead resistance left from the past year of trading.
02Open TradingView and check the watchlist first
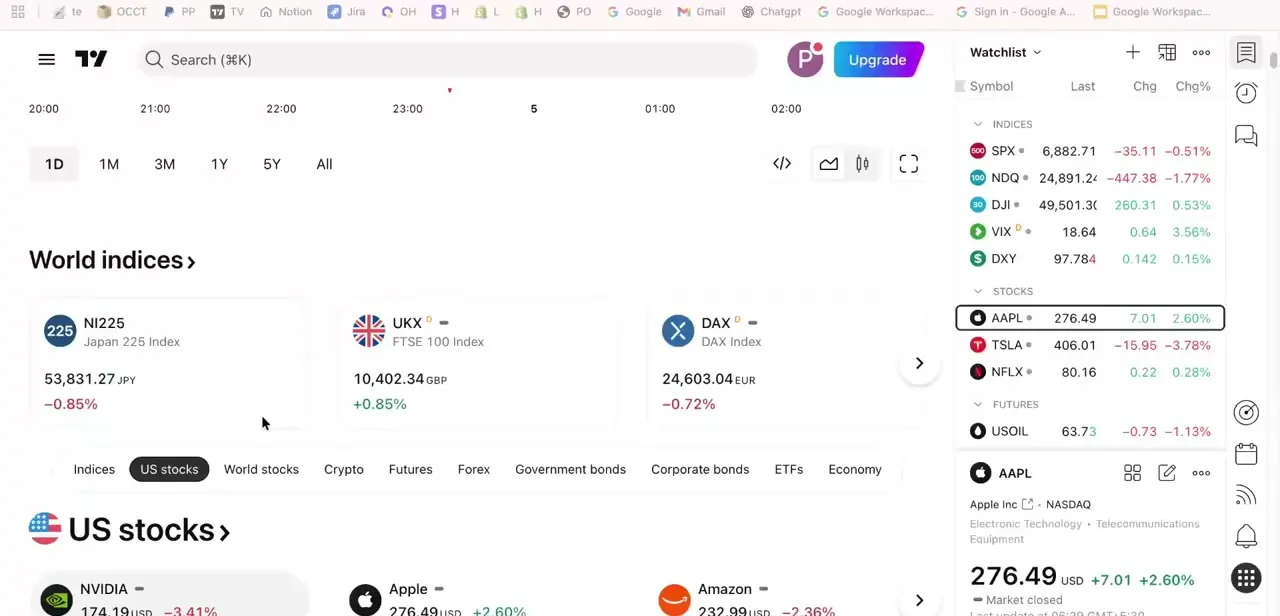
From TradingView's homepage you already get a live snapshot of major indices, world stocks, and your personal watchlist in the right-hand panel, with real-time price and percent-change data for names like Apple, Tesla, and Nvidia. This isn't the Screener itself, but it's a useful gut-check before you dive into filtering — if a stock you already follow is showing a sharp green move, it's worth noting before you go looking for others doing the same thing.
03Open the Stock Screener
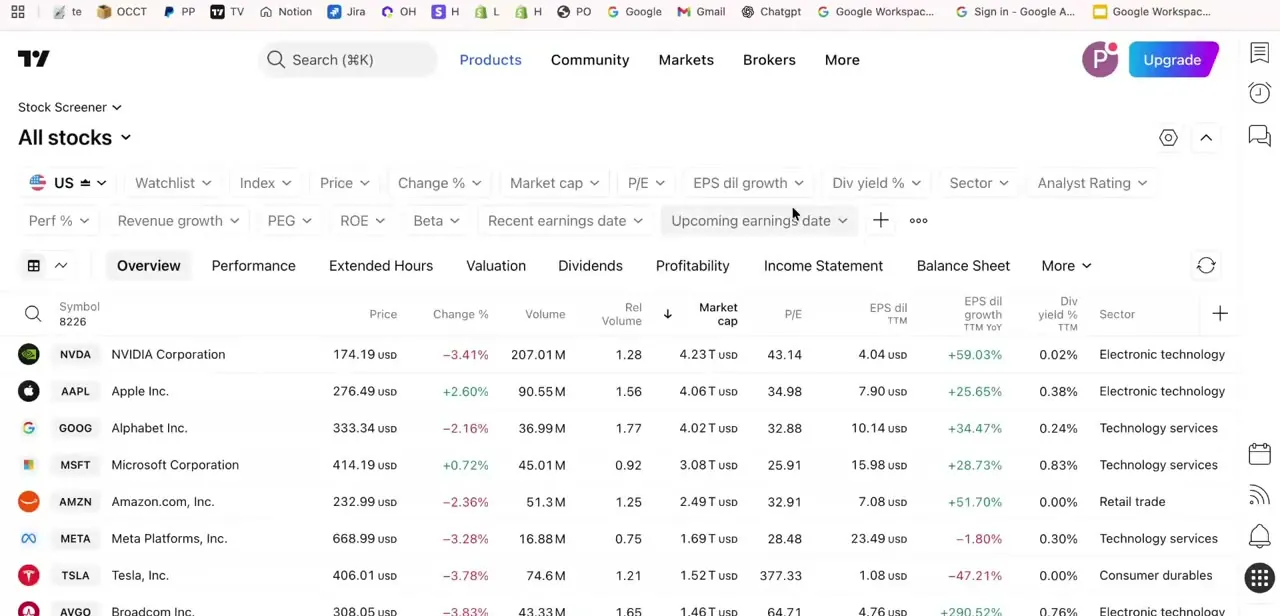
Navigate to the Stock Screener from TradingView's Products menu. The default view is 'All stocks' with a full row of filter dropdowns across the top — Watchlist, Index, Price, Change %, Market cap, P/E, EPS dil growth, Div yield %, Sector, Analyst Rating, and more — sitting above a sortable table of every stock in the market with columns for price, change, volume, relative volume, and market cap.
04Apply the New High 52 weeks filter
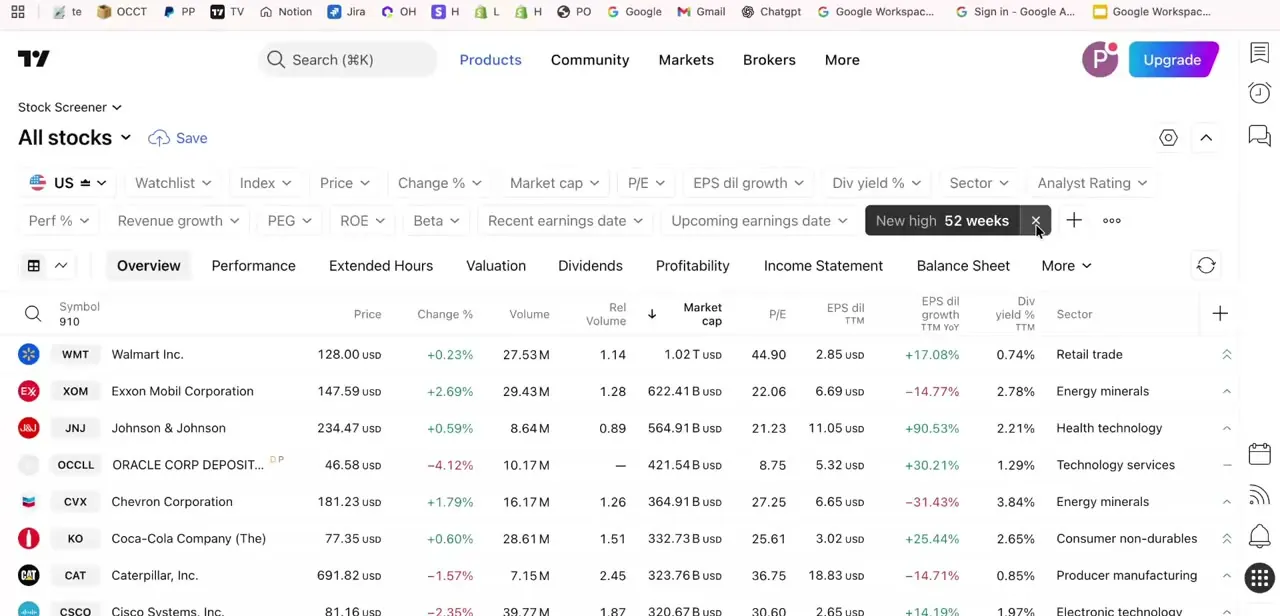
Click the '+' next to the existing filter row and search for the 52-week high filter — it appears in the toolbar as 'New high 52 weeks.' Adding it immediately cuts the table down from thousands of stocks to only those currently at a fresh yearly high, which in a real scan pulled the list down to under a thousand names including Walmart, Exxon Mobil, Johnson & Johnson, and Chevron. That's still a lot to work through, which is exactly why the next filters matter.
05Narrow further with volume, price, and market cap
A 52-week high on thin volume is far less meaningful than one backed by real participation, so add a minimum volume or relative volume filter to cut out illiquid names. Set a price range that fits what you're actually willing to trade, and add a market cap filter to decide whether you want large, liquid names or you're comfortable with the extra volatility of small caps. Sort the remaining list by relative volume to put the stocks with unusually high trading activity at the top — those are the ones most likely to be reacting to real news rather than drifting up on light volume.
06Confirm the breakout on the chart
A Screener match is a starting point, not a trade signal on its own. Click into each shortlisted symbol and check the chart directly: is the move backed by a volume spike, is price holding above the old high or immediately fading back below it, and do any indicators you rely on — moving averages, RSI, or volume profile — support the strength the Screener flagged? This step is what separates a real breakout candidate from a stock that briefly poked above its old high and reversed.
07Match the list to your trading style
How you use this shortlist depends on your timeframe. Intraday traders want the names with the heaviest relative volume and tightest spreads today.
Swing traders care more about a clean break with room to run before the next resistance level. Longer-term investors should weight fundamentals from the same Screener columns — P/E, EPS growth, sector — over the short-term price action, since a stock at a 52-week high can still be a poor long-term hold if the underlying business doesn't support the move.
Frequently asked questions
Is the Stock Screener free on TradingView?
Yes, the Stock Screener with core filters including the 52-week high filter is available on TradingView's free plan.
How do I filter specifically for 52-week highs?
Add the 'New high 52 weeks' filter from the '+' button next to the existing filter row in the Stock Screener — it isolates stocks currently trading at a fresh yearly high.
Why do some 52-week high stocks reverse quickly?
A breakout without strong volume support can fail and reverse fast, which is why confirming with volume and broader chart context on the individual stock's chart matters before treating a Screener match as a trade.
Can I save my Screener filters for future use?
Yes, TradingView lets you save a custom filter set — including the 52-week high filter plus your volume and market cap criteria — using the Save option in the Screener toolbar, so you can rerun the same scan later.
Should I trade every stock the Screener flags?
No. Treat the Screener as a shortlist generator, not a signal service — always confirm volume and price action on the individual chart, and weight the list differently depending on whether you trade intraday, swing, or long term.
About the author

Impran M N
I've been hooked on technology for as long as I can remember — especially the new tools and AI apps that seem to land every other week. Easy Tech Tuts is where I write up whatever I've just worked out: I do the task in the real product, record the screen, and turn it into the guide I wish I'd found first.