Easy Tech Tuts
How To Draw A Line In Tradingview, Make Straight Line Easily 2026
By Impran M N
A trend line is one of the simplest tools on a TradingView chart, but it's also one of the most used — it marks support, resistance, and the general direction of a move at a glance, without needing an indicator to do the work. This guide walks through the actual toolbar and settings panel as they appear on a live chart, from finding the drawing tool to adjusting the line's color and thickness once it's placed.
01Open your chart and locate the drawing toolbar
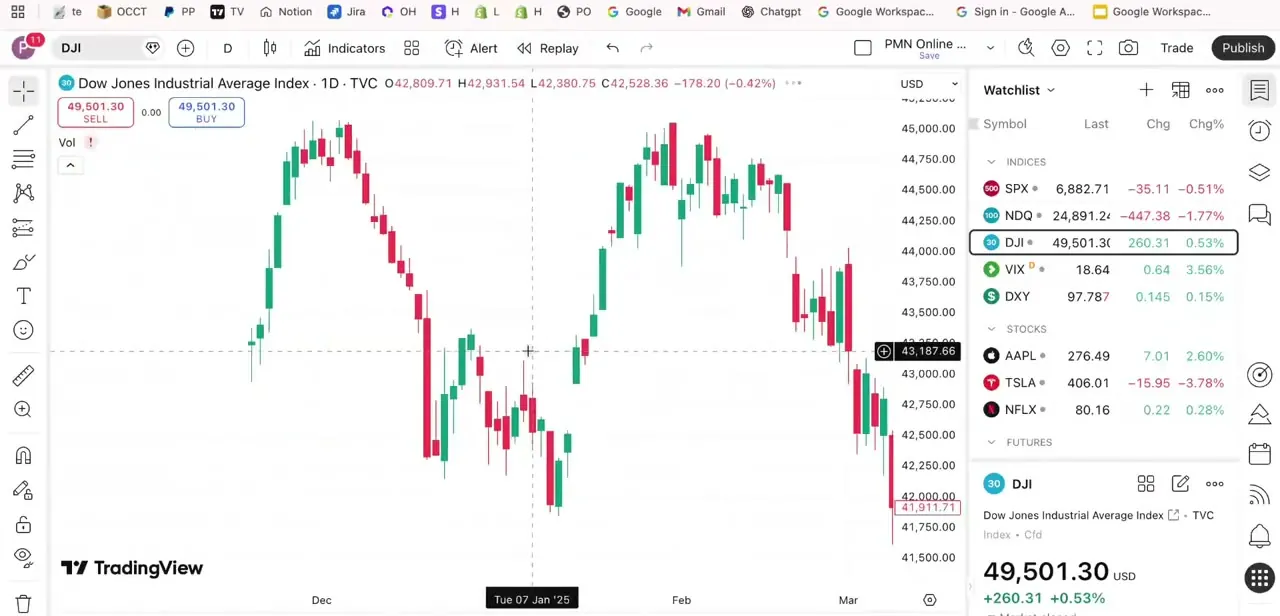
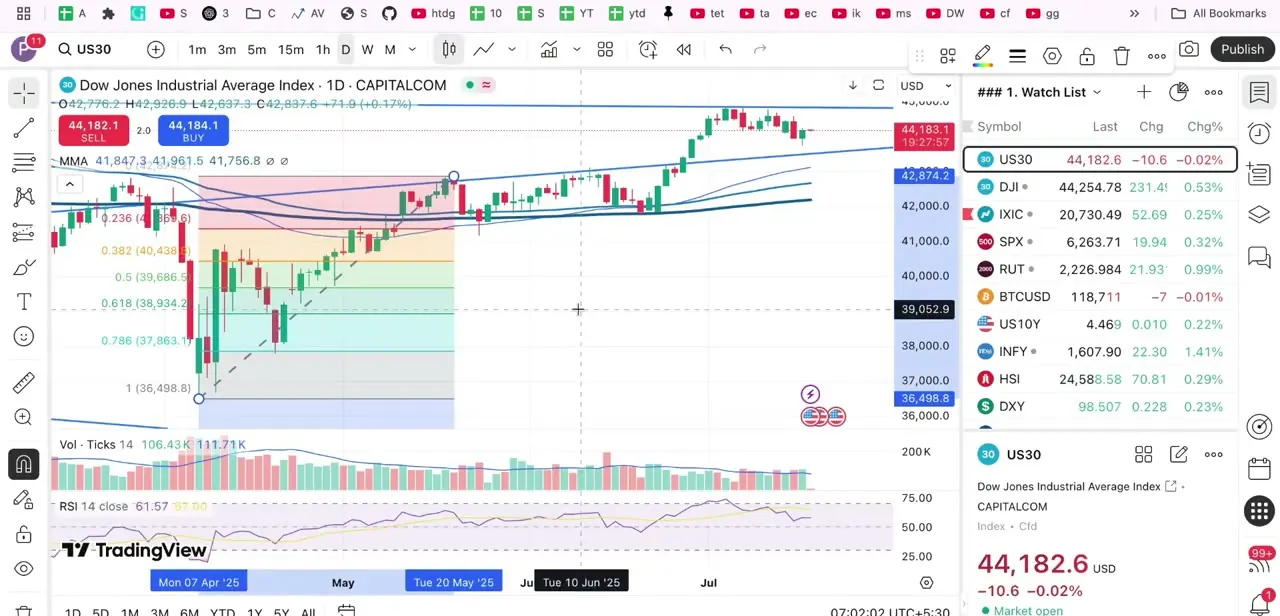
Log into TradingView and open the chart for whatever symbol you're analyzing — the example here is the Dow Jones Industrial Average on a daily timeframe. The drawing tools sit in a vertical strip down the left edge of the chart, separate from the timeframe and indicator controls along the top, and this is where every line, shape, and annotation tool lives.
02Select the trend line tool
Click the trend line icon in that left-hand toolbar — it's typically shown as a simple diagonal line and sits near the top of the tool list, close to other line-based tools like horizontal and vertical lines. Selecting it puts your cursor into drawing mode, ready for the next click on the chart itself.
03Click and drag to draw the line
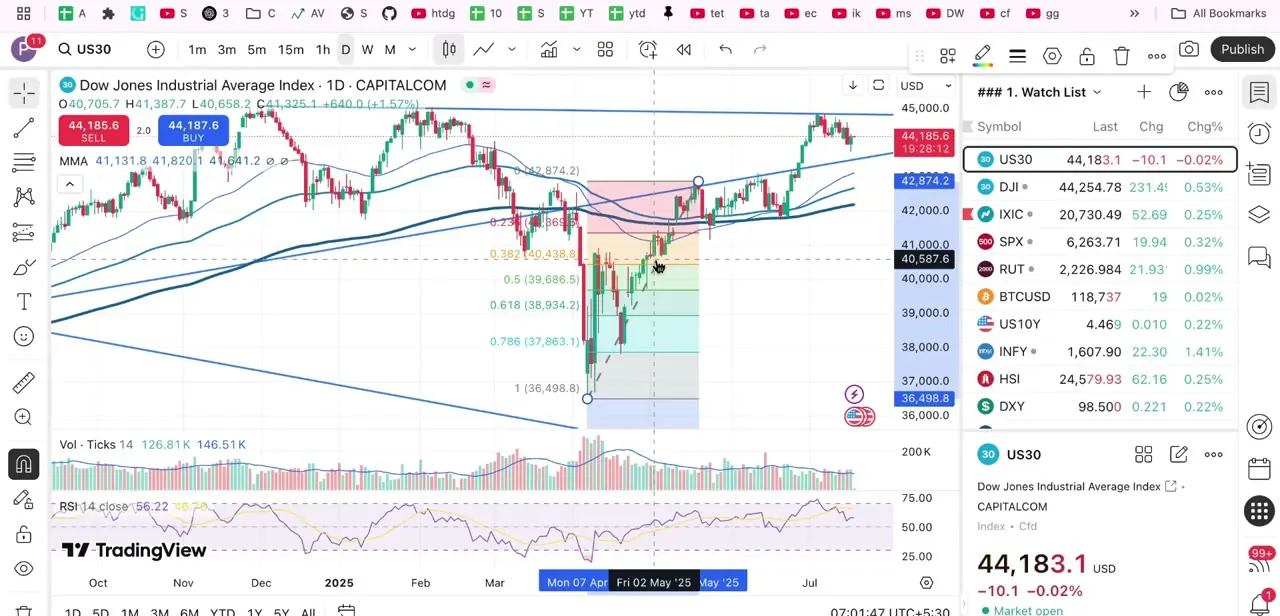
Click your starting point directly on the chart, hold, and drag to your intended endpoint before releasing the mouse button. In the example, the line runs from a swing low up through the recent price action, which is exactly how a trend line is meant to be used — anchored to two meaningful points rather than dropped arbitrarily. Once released, the line stays selected with small circular handles on each end, so you can immediately drag either point to fine-tune the angle.
04Adjust the line while it's still selected
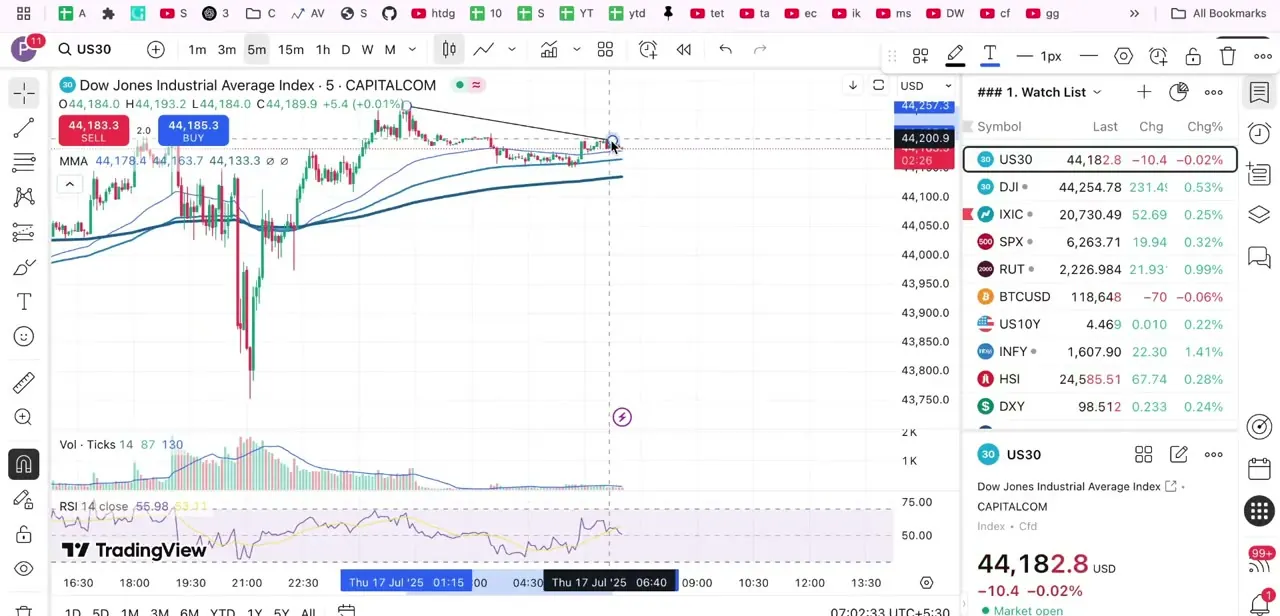
With the line selected, a small floating toolbar appears at the top of the chart showing color, line style, and thickness controls — a quick way to change the line's weight (the example shows it set to 1px) without opening a full settings menu. This is the fastest path for a small tweak, while the fuller settings panel is better when you want to change several properties at once.
05Open the full settings panel for more control
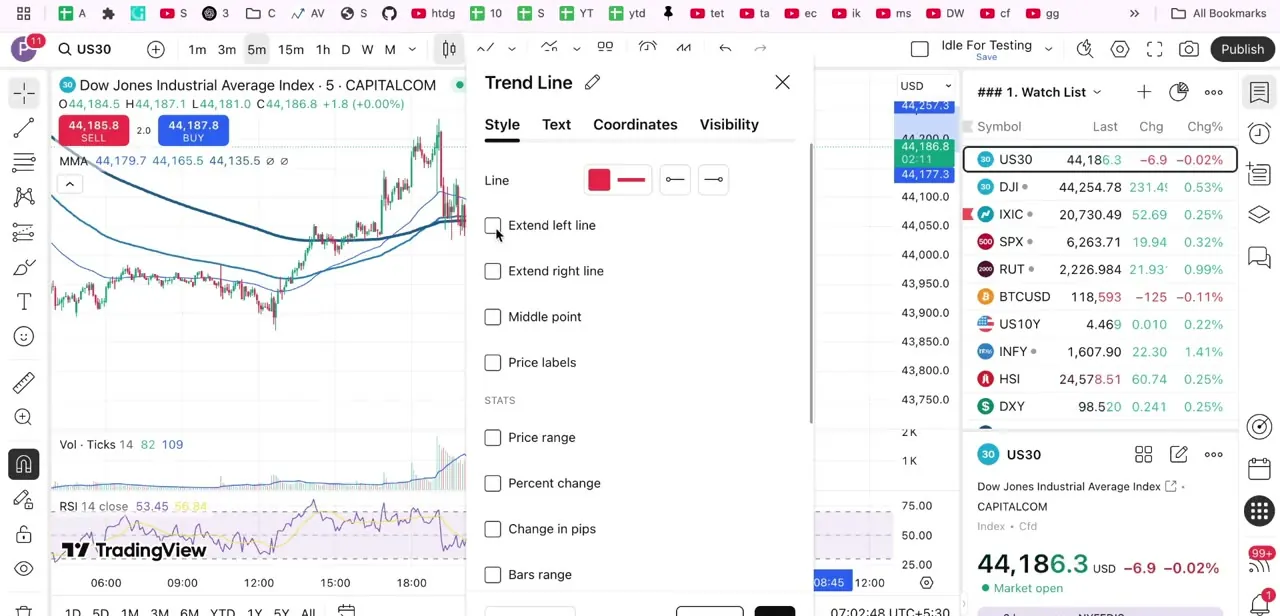
Right-click the line and choose its settings, or double-click it, to open the full Trend Line panel with Style, Text, Coordinates, and Visibility tabs. The Style tab is where most of the useful options live: line color and dash pattern, checkboxes for Extend Left Line and Extend Right Line if you want the trend to project beyond your two anchor points, a Middle Point toggle, and a Price Labels option, plus a Stats section that can display price range, percent change, and change in pips directly on the line.
06Remove a line you no longer need
Click the line once to select it and press the delete key, or right-click it and choose the remove option from the context menu — either works, and neither affects any other drawing on the chart. Clearing out old trend lines regularly keeps a chart readable, since a handful of unrelated lines from past analysis makes the current setup harder to read at a glance.
Frequently asked questions
How do I draw a straight line on TradingView?
Select the trend line tool from the left-hand toolbar, then click your starting point on the chart and drag to your endpoint before releasing.
Can I change the color of a line after drawing it?
Yes — select the line and use the small floating toolbar that appears above it for quick changes, or right-click and open the full settings panel for more color and style options.
How do I delete a line I drew?
Click the line to select it and press delete, or right-click it and choose the remove option from the context menu.
What is the trend line tool used for?
It's commonly used to mark support and resistance, highlight the direction of a price move, and connect swing highs or lows for a visual read on trend strength.
Can I extend a trend line beyond where I originally drew it?
Yes — open the line's settings panel and enable Extend Left Line or Extend Right Line to project the trend beyond your original two points.
About the author

Impran M N
I've been hooked on technology for as long as I can remember — especially the new tools and AI apps that seem to land every other week. Easy Tech Tuts is where I write up whatever I've just worked out: I do the task in the real product, record the screen, and turn it into the guide I wish I'd found first.