Easy Tech Tuts
How to Change Chart Layout on TradingView 2026
By Impran M N
Trading more than one instrument while stuck on a single chart means constant tab-switching. TradingView's layout system splits the workspace into two, three, four, or more panes so everything is visible at once, with the symbol, timeframe, and crosshair able to move together across all of them. This guide walks through the layout picker, the sync toggles beneath it, and a detail that catches people out: the free plan doesn't include multi-chart layouts at all, not even two panes.
01Start from your normal single chart
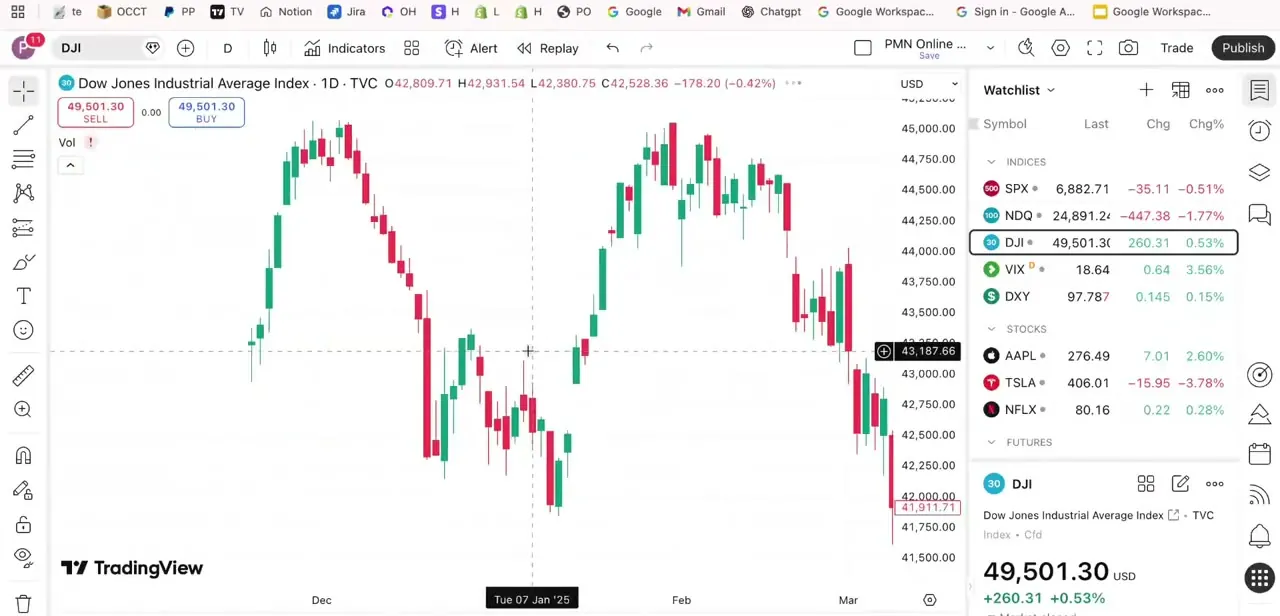
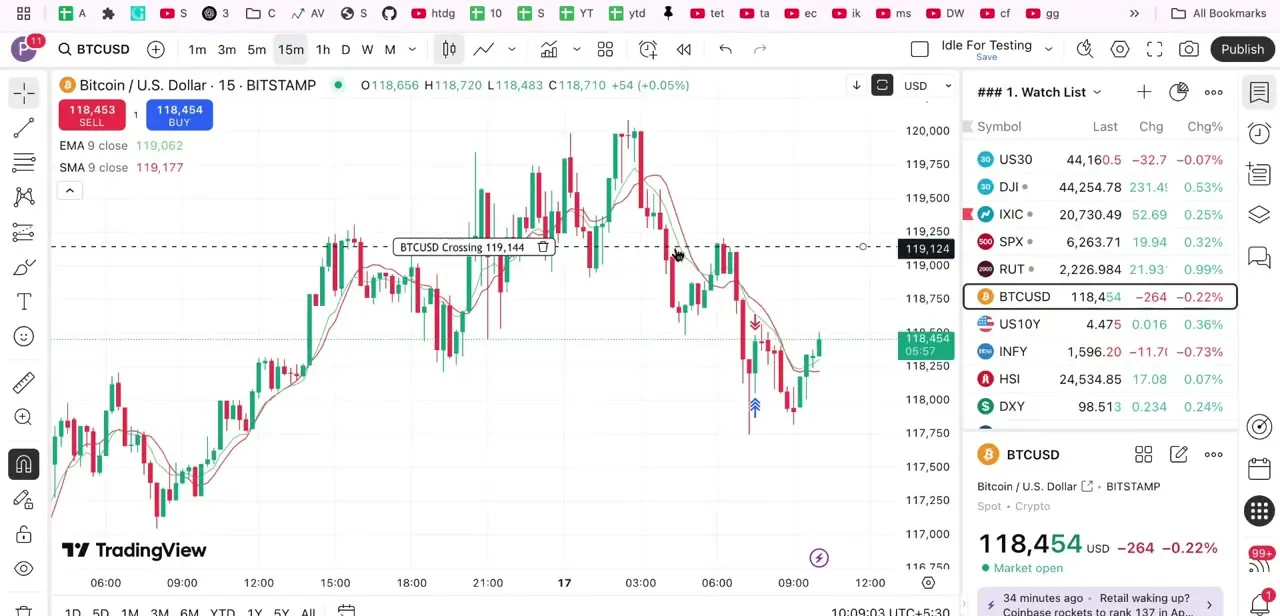
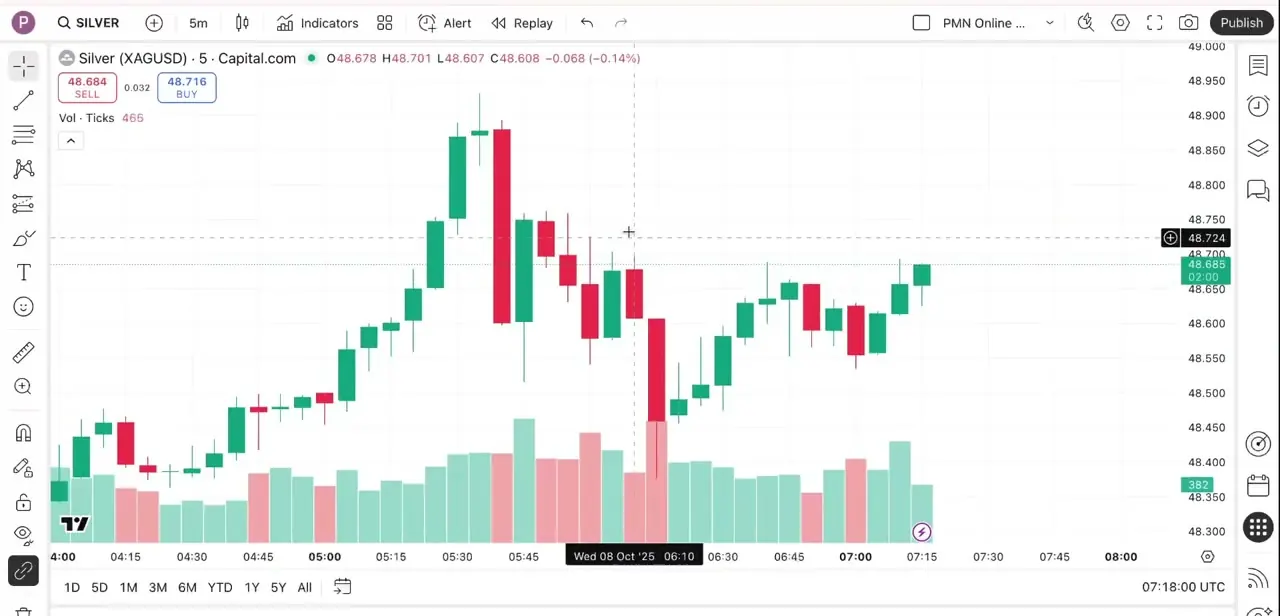
Before touching layouts, this is one instrument in the standard TradingView chart view: price candles up top, a volume histogram underneath, and the usual drawing toolbar down the left edge. It works fine for watching one market at a time.
Tracking more than one symbol, or comparing a short timeframe against a longer one on the same asset, is where a single pane starts costing tab-switching time. That's the problem the layout picker solves.
02Open the layout icon and pick an arrangement
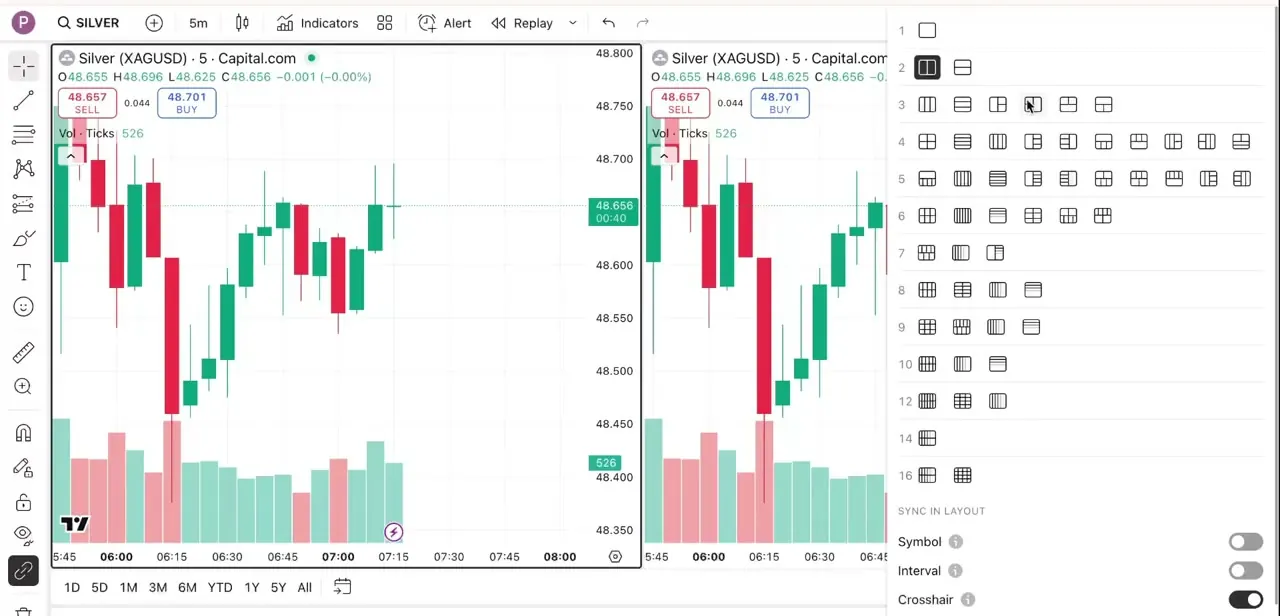
In the top toolbar, the layout icon opens a panel showing every split TradingView supports, arranged in rows from a single chart up to sixteen panes. Row 2 is a basic vertical or horizontal split into two charts, row 3 adds three-pane combinations, and it keeps scaling from there.
How far up that list is actually clickable depends on the account's plan, covered in a later step. Below the grid sits "Sync in layout," with three toggles: Symbol, Interval, and Crosshair.
Turning these on is what keeps panes moving together instead of behaving as separate, unrelated charts. TradingView also offers a per-chart symbol and interval grouping tool (a small icon in each chart's status line, using matching colored markers) for syncing only some charts in a layout rather than all of them, which is worth knowing about even though it isn't in this panel.
03Pick the pane count and orientation
Click a thumbnail and TradingView redraws the workspace into that many panes: the two-chart row for a side-by-side comparison, or a denser grid for a basket of instruments. Each new pane starts as a live, independent chart with its own price scale and toolbar, so a different symbol or timeframe can be set in each one right after the split.
Most splits also come in row-based and column-based versions, so a three-chart layout can run left to right or stack top to bottom. Widescreen setups generally suit horizontal splits, since each pane gets more usable width, while a taller display works better stacked. Orientation is purely a screen-space decision; it doesn't change which charts are synced or what's plotted on them.
04Sync symbols, timeframes, and crosshair across charts
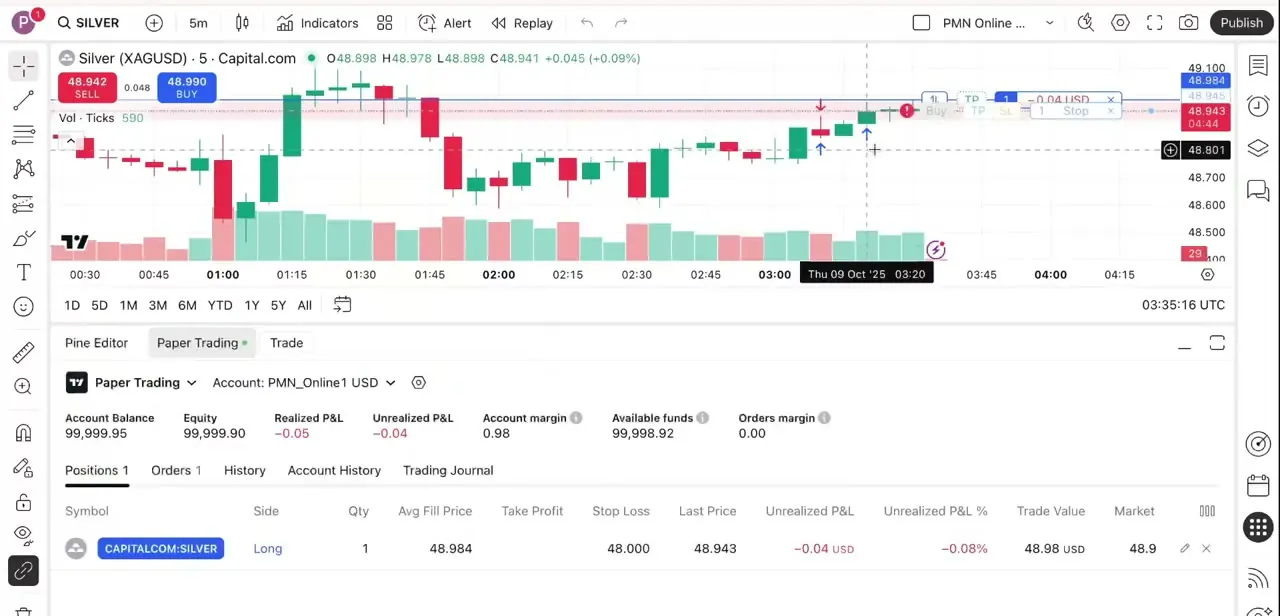
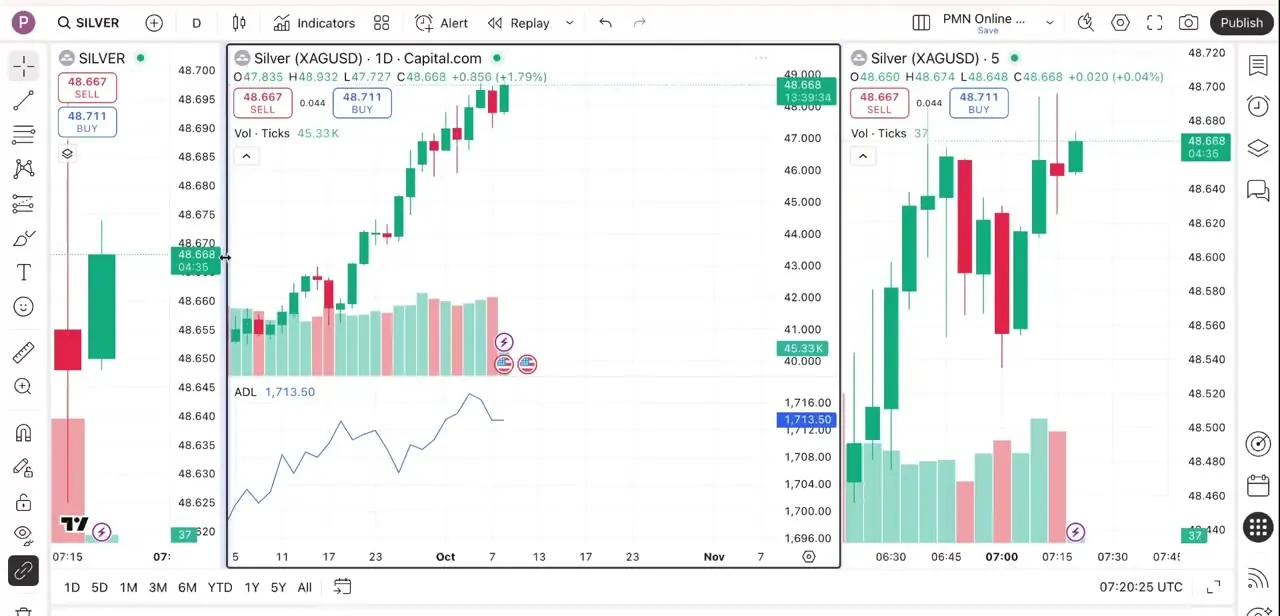
With sync switched on, changing the symbol or timeframe in one pane pushes that change to every other pane in the layout, and moving the cursor draws a matching crosshair line across all of them. This is what turns a multi-chart layout into an analysis tool: the same instrument can sit on a daily candle in one pane and a five-minute candle in another, so a signal on the higher timeframe can be checked against what's happening on the lower one in real time. The example here shows exactly that: a daily chart next to intraday charts of the same silver contract, all updating together instead of drifting apart.
05Know what's free and what needs a paid plan
The free Basic plan allows exactly one chart per tab, so none of the multi-pane grids in the picker are usable on it, not even the simplest two-chart split. Every paid tier raises the ceiling: Essential unlocks 2 charts per tab, Plus 4, Premium 8, and Ultimate the full 16-chart grid.
The picker itself still shows every grid regardless of plan; clicking one above the account's limit is what prompts an upgrade, not a hidden restriction. Essential, Plus, and Premium each include a 30-day free trial, and Ultimate includes a 14-day trial, so a denser layout can be tried before committing to it.
06Save, rename, and reset layouts
Once an arrangement looks right, save it as a named layout (Ctrl+S, or Cmd+S on a Mac) to reload at the start of the next session instead of rebuilding it. How many layouts can be kept at once is also plan-limited: one on Basic, five on Essential, and ten on Plus, Premium, and Ultimate. Layouts can be renamed or duplicated from the Manage layouts menu, which is also where a cluttered arrangement is easiest to replace: create a fresh layout rather than fighting the existing grid back into shape.
| Plan | Charts per tab | Saved layouts |
|---|---|---|
| Basic (free) | 1 | 1 |
| Essential | 2 | 5 |
| Plus | 4 | 10 |
| Premium | 8 | 10 |
| Ultimate | 16 | 10 |
From TradingView's official pricing page, current as of September 2026. Essential, Plus, and Premium include a 30-day free trial; Ultimate includes a 14-day trial.
When it doesn't work
The multi-chart grids in the layout picker won't click
Why: The account is on the free Basic plan, which allows only one chart per tab. None of the split layouts are usable until the plan changes.
Fix: Start a trial (30 days on Essential, Plus, or Premium; 14 days on Ultimate) or upgrade. Essential alone is enough for a basic 2-chart split.
The denser grids (8 or 16 panes) are visible but locked
Why: 8-chart layouts require Premium and the full 16-chart grid requires Ultimate; Essential and Plus cap out lower.
Fix: Check the current plan against the chart-per-tab table below, and upgrade only as far as the pane count actually needed.
Can't save a second layout
Why: The Basic plan allows exactly one saved layout at a time.
Fix: Either overwrite the existing saved layout, or move to Essential, which raises the limit to five.
Frequently asked questions
Is multi-chart layout free on TradingView?
No. The free Basic plan is limited to one chart per tab, so none of the split layouts are usable on it. The lowest paid tier, Essential, unlocks 2 charts per tab.
Can I sync different symbols across multiple charts?
Yes. Leave the Symbol toggle off to let each pane hold a different instrument while still syncing Interval or Crosshair, or use the status-line grouping tool to sync only some charts in the layout.
How many charts can I view at once?
Up to 16 in one layout, but only on Ultimate. Essential allows 2, Plus 4, and Premium 8; the free Basic plan allows just 1, meaning no split at all.
How many layouts can I save?
One on the free Basic plan, five on Essential, and ten on Plus, Premium, and Ultimate.
Can I try a denser layout before paying for it?
Yes. Essential, Plus, and Premium come with a 30-day free trial, and Ultimate with a 14-day trial, so a higher pane count can be tested first.
Does changing a layout's orientation break the sync?
No. Switching between a row-based and column-based version of the same split only changes how panes are arranged on screen; sync settings and each pane's symbol or timeframe stay as they were.
Sources and last check
Click path, the layout grid, and the three sync toggles come from a walkthrough recorded on the actual interface and were checked directly against those screenshots. Plan limits were re-checked against TradingView's official pricing page in September 2026, which corrected the previous version of this guide: the free Basic plan does not include any multi-chart layout, not a reduced one, and it caps saved layouts at one rather than allowing several. Exact chart-per-tab and saved-layout figures by plan, along with trial lengths, were added from that same page. The double-click-to-reset behaviour mentioned in an earlier draft could not be confirmed against TradingView's documentation and has been removed rather than left unverified.
About the author

Impran M N
I've been hooked on technology for as long as I can remember — especially the new tools and AI apps that seem to land every other week. Easy Tech Tuts is where I write up whatever I've just worked out: I do the task in the real product, record the screen, and turn it into the guide I wish I'd found first.