Easy Tech Tuts
How to Change Candle Colors on Tradovate, Adjust Candlestick Style in Web App 2026 Easily
By Impran M N
A chart that's easy to read at a glance matters when you're watching futures move in real time, and the Tradovate Web App gives you full control over how every candle looks. This guide walks through opening the chart's element menu, reaching the Chart Editor underneath it, and setting distinct colors for up candles, down candles, wicks, and outlines. It also covers the fill, trade-line, and template options that sit alongside color in the same panel, so your whole chart style gets set in one pass and carries to your other charts.
01Start from a loaded chart in the Web App
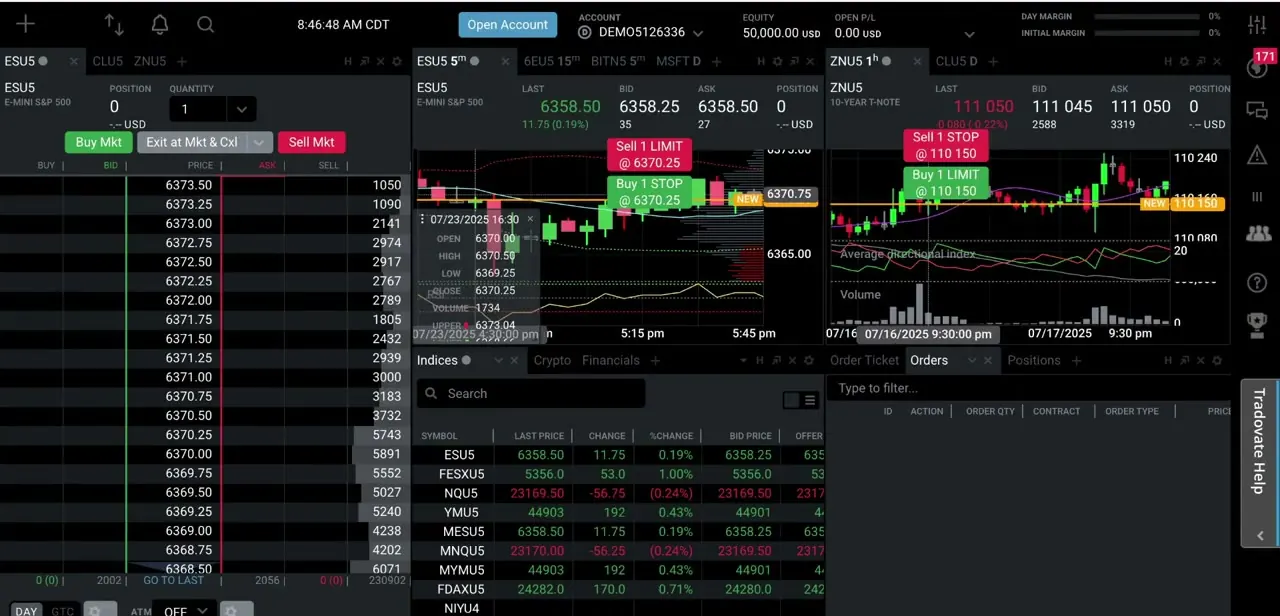
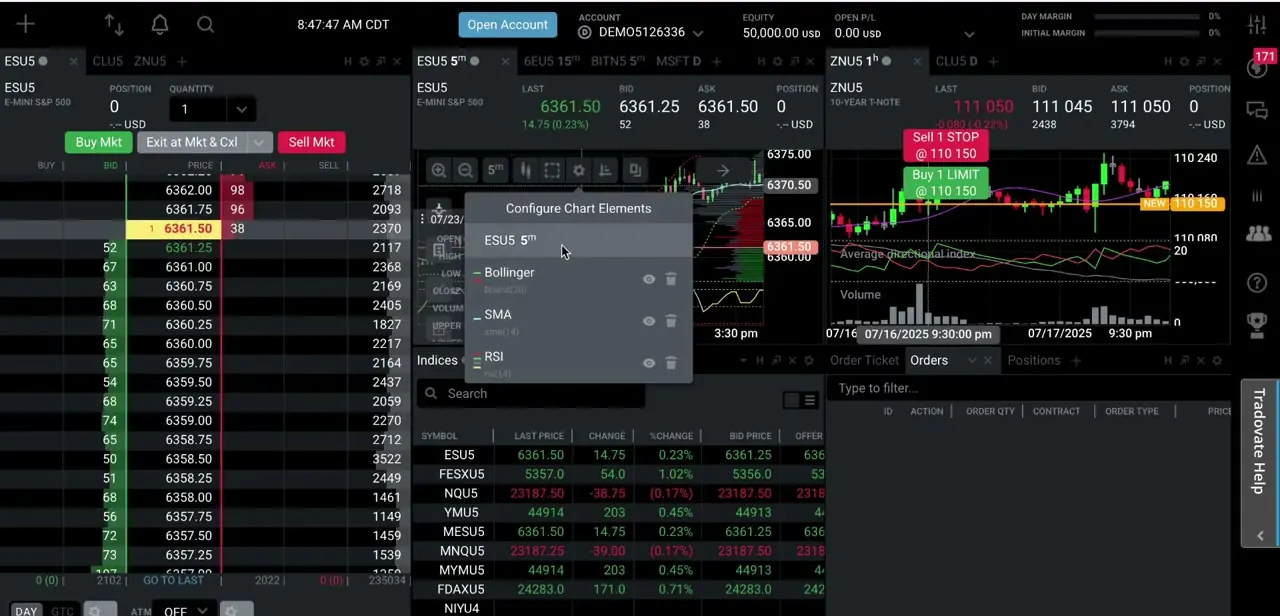
Everything in this guide happens from inside an open chart panel. This example shows an ESU5 5-minute candlestick chart sitting alongside a second instrument chart and a live order book. Tradovate's layout keeps multiple charts, an order ticket, and your positions all visible at once, and the toolbar running along the top of each individual chart panel is where its display settings live, separate from the account-wide controls at the very top of the window.
02Open Configure Chart Elements, then the Chart Editor
Click the gear icon in the chart's toolbar to open Configure Chart Elements. This panel lists everything currently layered onto the chart, in this case Bollinger Bands, an SMA, and an RSI, each with an eye icon to toggle visibility and a trash icon to remove it entirely.
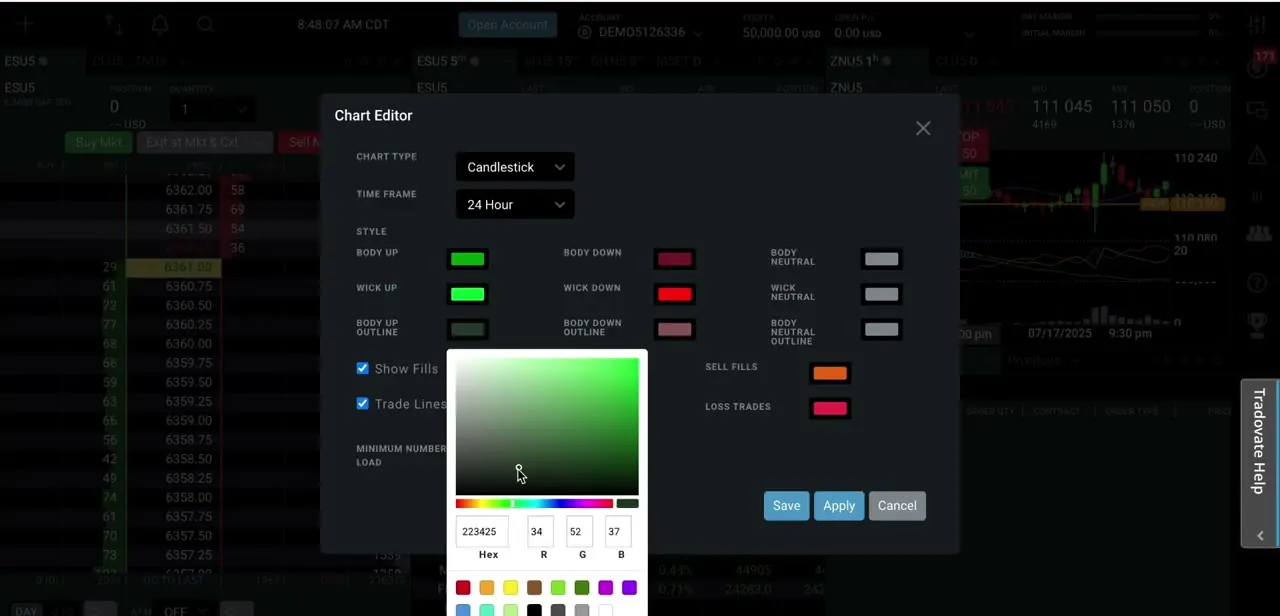
It isn't the color editor itself; it's the doorway to it. The chart's own name appears at the top of this list, and clicking it opens the Chart Editor, a dedicated dialog for chart type, time frame, and, the reason you're here, candle styling. Chart Type is set to Candlestick and Time Frame to whatever interval the chart is currently showing, both adjustable from dropdowns at the top of the dialog.
03Set body, wick, and outline colors
The Style section of the Chart Editor breaks candle color into nine separate swatches: Body Up, Body Down, and Body Neutral for the fill, Wick Up, Wick Down, and Wick Neutral for the thin lines above and below each candle, and matching outline colors for all three. Clicking any swatch opens a full color picker with a gradient field, a hue slider, and hex plus RGB input boxes, so you can drag to a shade or type an exact hex code if you're matching a color from another platform.
Bright green for up candles and deep red for down is the default most traders start from, but set the wick and outline colors independently too. A wick close to the background color disappears at a glance, which defeats the point of customizing in the first place.
04Decide on fills, trade lines, and order-marker colors
Below the color grid, Show Fills and Trade Lines are simple checkboxes. Show Fills controls whether candle bodies are solid or hollow outlines, and Trade Lines overlays your own executed orders directly on the price action, useful for reviewing how a trade played out relative to the candles around it.
Body Neutral and Wick Neutral cover candles that close exactly where they opened; leaving that at the default gray is usually clearer than forcing it into either the up or down color. Two more color options sit apart from the candle styling: Sell Fills and Loss Trades, which color your own order markers on the chart, not the price candles. Setting Loss Trades to something visually loud, the default is a strong red, makes losing trades easier to spot in your history without opening a separate reports tab.
05Save the style as a Chart Template
Once every color looks right, use Apply to preview the change on the live chart without closing the dialog, then Save. Tradovate stores color and style choices as part of a Chart Template instead of locking them to the single panel you edited.
Save the template, and you can apply the same look to any other chart, including new ones you open later, instead of rebuilding it swatch by swatch each time. Tradovate also supports separate color schemes for Light Mode and Dark Mode, switching automatically with your platform theme. If you run both, set up a scheme for each so a wick that reads clearly in dark mode doesn't wash out the moment you flip to light.
Frequently asked questions
Can I change candle colors in Tradovate without third-party tools?
Yes. The Chart Editor built into the Tradovate Web App lets you set body, wick, and outline colors natively, no extension or third-party charting tool needed.
Where do I find the candle color settings?
Click the gear icon on a chart panel to open Configure Chart Elements, then select the chart itself from that list to open the full Chart Editor with the Style section.
What's the difference between Body Up/Down and Wick Up/Down?
Body colors set the fill of the candle itself, while Wick colors set the thin lines extending above and below it that represent the high and low. Tradovate lets you set each independently, plus separate outline colors for both.
Does changing candle colors apply to every chart in my layout?
Not automatically to charts you haven't touched, but you don't have to rebuild the style on each one by hand either. Save your choices as a Chart Template and apply that template to other chart panels, including new ones, to carry the same colors over.
What do Sell Fills and Loss Trades control?
These color your own order markers and trade-history overlays on the chart, separate from the candlesticks, useful for spotting losing trades at a glance while reviewing price action.
Does charting cost extra on Tradovate?
No. Charting and chart styling are included with every Tradovate plan. A separate market-data subscription may still apply for live quotes on some exchanges, but that's unrelated to the charting tools themselves.
Sources and last check
Click path and screens come from a walkthrough recorded in 2026. Tradovate's own Help Center article on chart styles (support.tradovate.com) renders client-side and could not be retrieved by automated fetch in this session, so the Chart Template and light/dark scheme behavior described here was cross-checked instead against two independent third-party Tradovate charting guides that agree with each other; treat that specific detail as corroborated, not vendor-confirmed. The claim that charting is included on every plan was checked directly against Tradovate's official pricing page in September 2026.
About the author

Impran M N
I've been hooked on technology for as long as I can remember — especially the new tools and AI apps that seem to land every other week. Easy Tech Tuts is where I write up whatever I've just worked out: I do the task in the real product, record the screen, and turn it into the guide I wish I'd found first.