Easy Tech Tuts
How to Add Nifty Options in TradingView Easily 2026
By Impran M N
Typing "Nifty" into TradingView's search bar gets you the spot index or a futures contract almost every time — not the specific options contract you actually wanted to chart. Options symbols are named with a strict code that bundles the expiry date, contract type, and strike price together, and unless you filter for it directly, it's easy to end up analyzing the wrong instrument entirely. This guide covers how to search properly, filter down to Options, and read the strike-and-expiry list so you load the exact CE or PE contract you meant to trade.
01Open the symbol search
From any TradingView chart or the homepage, click the search bar at the top (or press the keyboard shortcut) to open the symbol search panel. This is the same search used for stocks, futures, and forex, which is exactly why a plain "Nifty" query returns a mix of everything rather than the option contract you're after.
02Search Nifty and see what surfaces by default
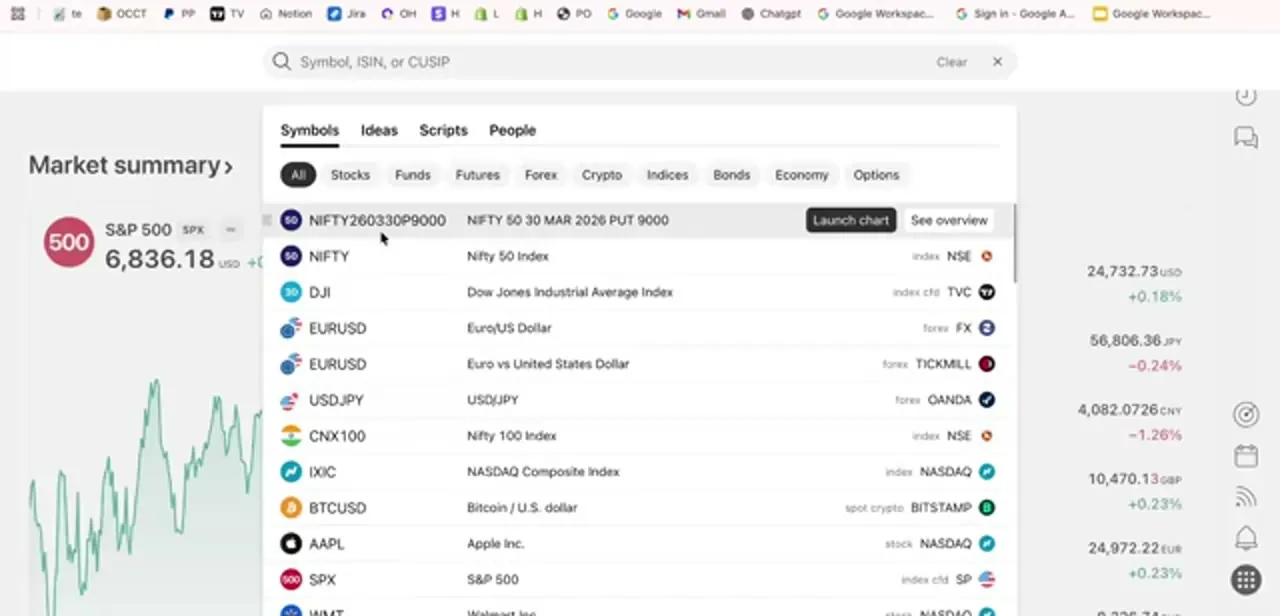
Typing the symbol brings back a mixed list: the Nifty 50 spot index, Bank Nifty, Dow Jones, and other unrelated tickers sorted by relevance rather than by contract type. You can already spot options-style entries in the results, like NIFTY260330P9000, which decodes as Nifty 50, expiring 30 March 2026, a Put, at strike 9000 — but scrolling through a mixed list to find the right one isn't reliable, which is why the next step matters.
03Notice that spot and futures results look similar to options
Searching a query like "nifty 18000" without narrowing the instrument type still returns index and futures entries — Nifty 50 Index, Nifty Bank Index, and GIFT Nifty 50 Index Futures — none of which are the options contract implied by the number. This is the trap: the strike price you typed doesn't filter anything on its own, so you can end up charting a futures contract while thinking you selected an option.
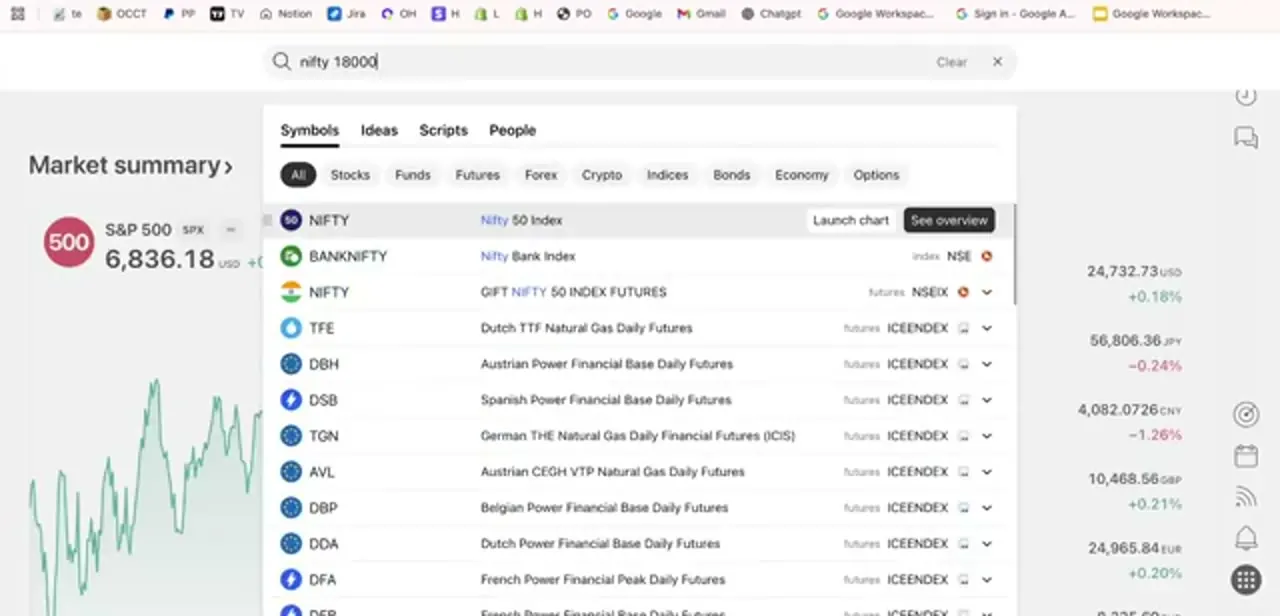
04Filter to Options and pick the strike and expiry
Above the results list, TradingView shows category tabs — All, Stocks, Funds, Futures, Forex, Crypto, Indices, Bonds, Economy, and Options. Click Options, and the list changes entirely to rows like NIFTY260217C26000 and NIFTY260217P26000, each formatted as symbol, expiry date, contract type, and strike. Scroll to the exact expiry and strike you want to view, and you're now looking only at genuine option contracts rather than a mixed instrument list.
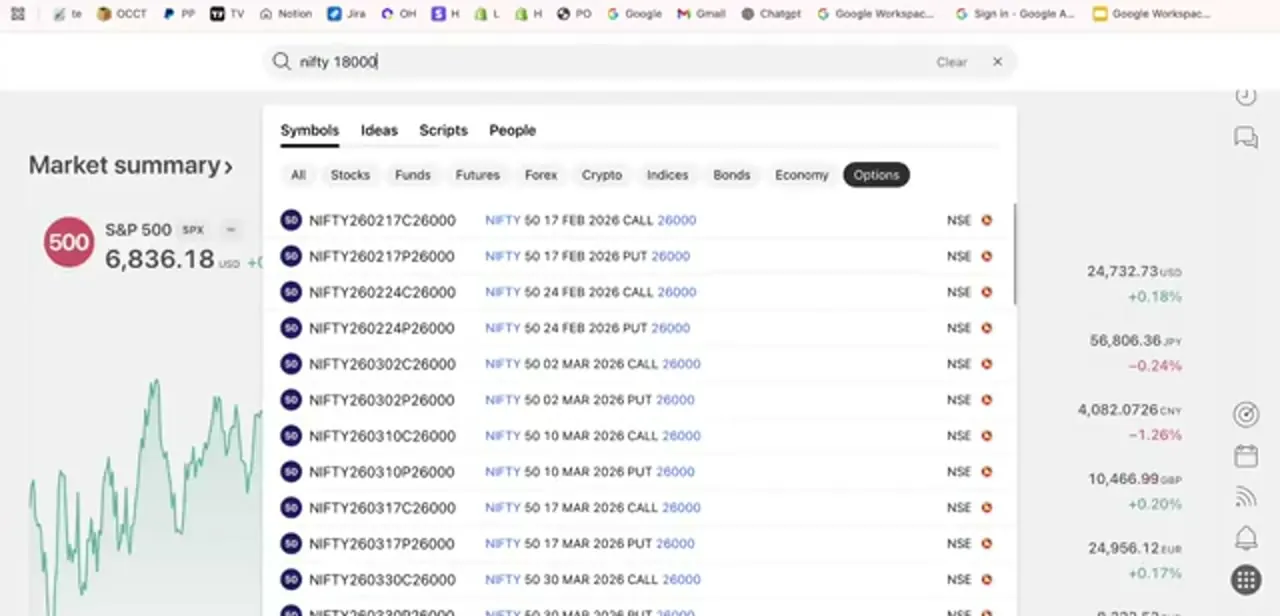
05Tell CE and PE apart in the symbol
The letter right after the expiry date in the symbol is the giveaway: C means Call (CE) and P means Put (PE). NIFTY260217C19600 is a call at strike 19600 expiring 17 February 2026, while the P version at the same strike and date is the matching put. Confirm you've clicked the right letter before loading the chart — a call and a put at the identical strike and expiry behave completely differently, and it's an easy click to get backwards in a long scrolling list.
06Load the chart for the selected contract
Once you click the contract you want, TradingView shows it as the active symbol at the top of the panel — for example NIFTY260330P18000 — with a preview chart and a Full chart button to open it in the main workspace. This confirms you're now looking at that specific put or call rather than the spot index or a futures series, which is the whole point of filtering through Options in the first place.
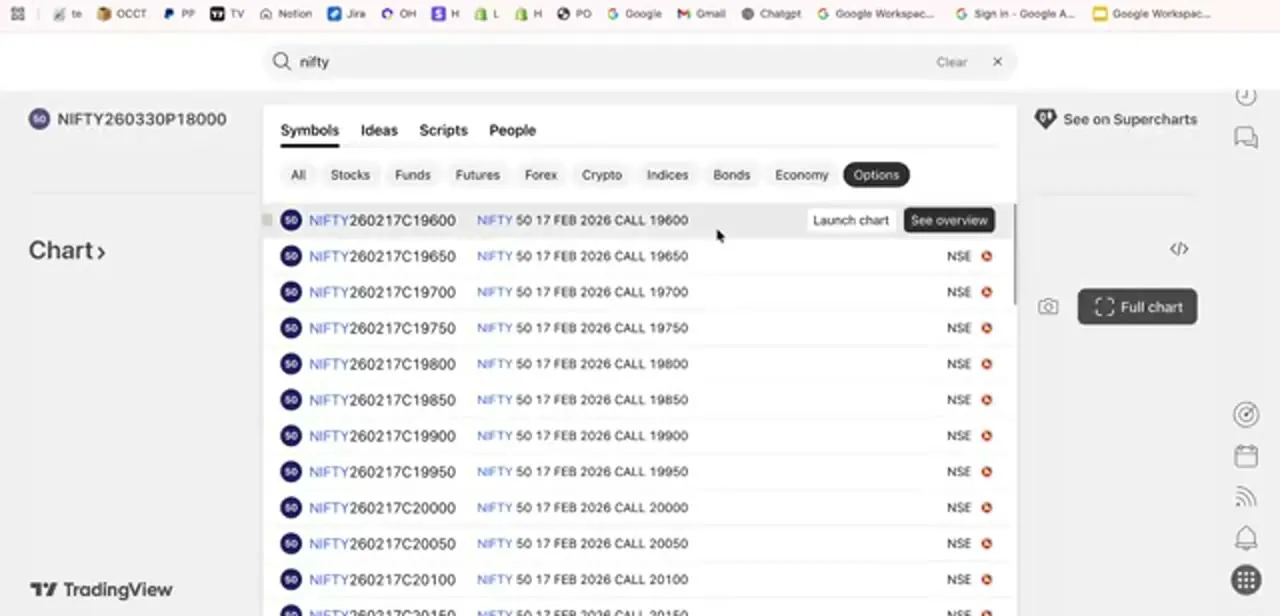
07Read the chart with options behavior in mind
Option charts move differently from the underlying index because they combine price direction with time decay and changing volatility, especially as expiry approaches. Expect thinner volume and choppier candles than you'd see on the Nifty spot chart, particularly on strikes further from the current price, and remember that a contract's price history effectively resets each time you roll to a new expiry — there's no continuous multi-month chart the way there is for the underlying index.
Frequently asked questions
Can I add Nifty options directly to my watchlist?
Yes — once you've filtered to Options and found the specific contract through symbol search, you can add it to your watchlist the same way you would any other symbol.
Why do Nifty options charts sometimes look choppy?
Options generally trade at lower volume than the underlying index, and their price reacts to time decay and volatility shifts on top of the index's own movement, which produces more erratic candles.
What's the difference between Nifty spot and Nifty options?
The spot index (NIFTY) reflects the live value of the underlying basket of stocks. Options are separate derivative contracts tied to that index, each with its own strike, expiry, and pricing — shown in results like NIFTY260217C19600.
How do I tell a call from a put in the symbol name?
Look at the letter right after the expiry date in the contract code: C means Call, P means Put. NIFTY260217C19600 is a call; NIFTY260217P19600 is the matching put at the same strike and expiry.
Do Nifty options expire, and does that affect the chart?
Yes. Each contract has a fixed expiry baked into its symbol, and its chart history only exists up to that date — there's no rolling continuous options chart the way there is for the spot index.
About the author

Impran M N
I've been hooked on technology for as long as I can remember — especially the new tools and AI apps that seem to land every other week. Easy Tech Tuts is where I write up whatever I've just worked out: I do the task in the real product, record the screen, and turn it into the guide I wish I'd found first.