Easy Tech Tuts
How to See or Track Previous Sprint History in Jira Easily 2026
By Impran M N
Once a sprint closes in Jira, its board view empties out — but the data isn't gone, it just moves to Reports. That's where velocity, completed work, and the day-by-day burndown of a finished sprint actually live, and it's a section a lot of teams never open because nothing points you there directly from the board. This guide covers navigating from your project's board to its sprint reports, reading a burndown chart correctly, and using the detailed event log underneath it to see exactly when each issue moved, completed, or got pulled from the sprint.
01Open your board and find the Reports tab
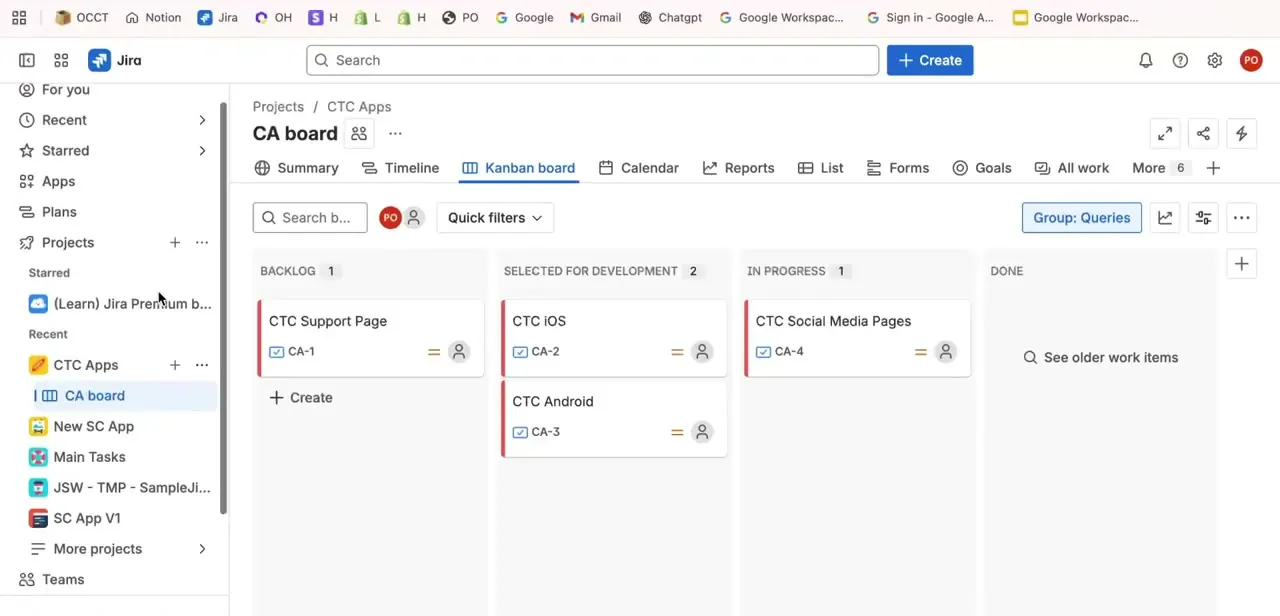
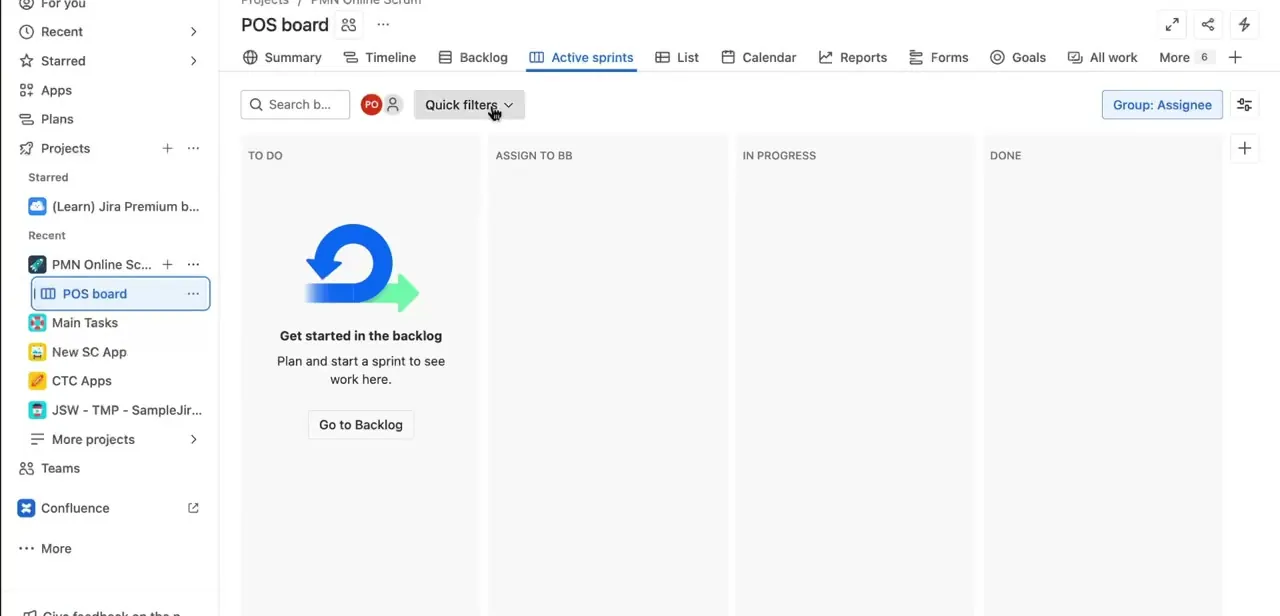
From your project, open its board and look at the row of tabs across the top: Summary, Timeline, Backlog, Active sprints, List, Calendar, and Reports. Reports is where all historical sprint data lives, separate from Active sprints, which only shows what's currently in progress or not yet started. If your Active sprints view looks empty with a prompt to plan work in the backlog, that just means no sprint is currently running — it doesn't mean history isn't available, that's still sitting under Reports.
02Select a past sprint from the Burndown Chart
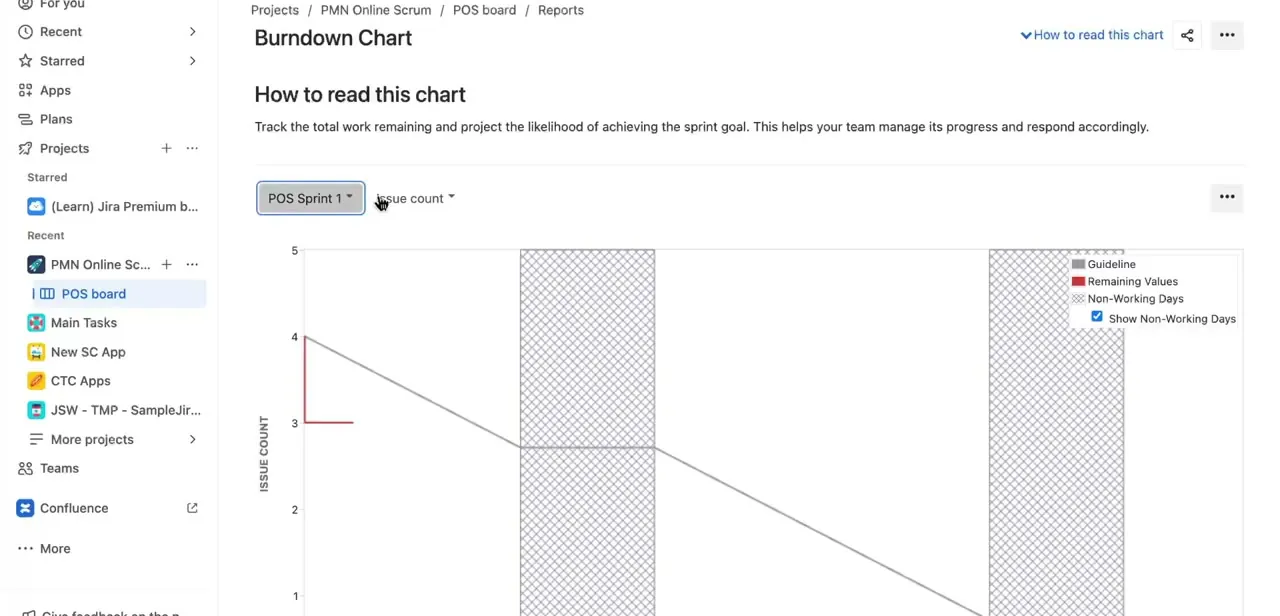
Inside Reports, choose Burndown Chart, then use the sprint dropdown at the top — labeled with the current or most recent sprint name — to switch to any earlier sprint your project has run. Next to it, a second dropdown lets you toggle how work is measured, typically Issue count or Story points, which changes what the vertical axis represents. Picking an older sprint here instantly reloads the chart with that sprint's specific data rather than requiring you to dig through a separate archive.
03Read the chart correctly
The burndown chart plots issue count (or story points) remaining against time across the sprint's date range. A gray guideline shows the ideal, steady pace needed to finish everything by the sprint's end date, while the colored line tracks what actually happened — work completed, added mid-sprint, or left over. Sudden jumps upward usually mean scope was added after the sprint started, while a flat line for several days points to a stretch where nothing was completed, both worth discussing in a retrospective rather than just noting in passing.
04Check the detailed event log below the chart
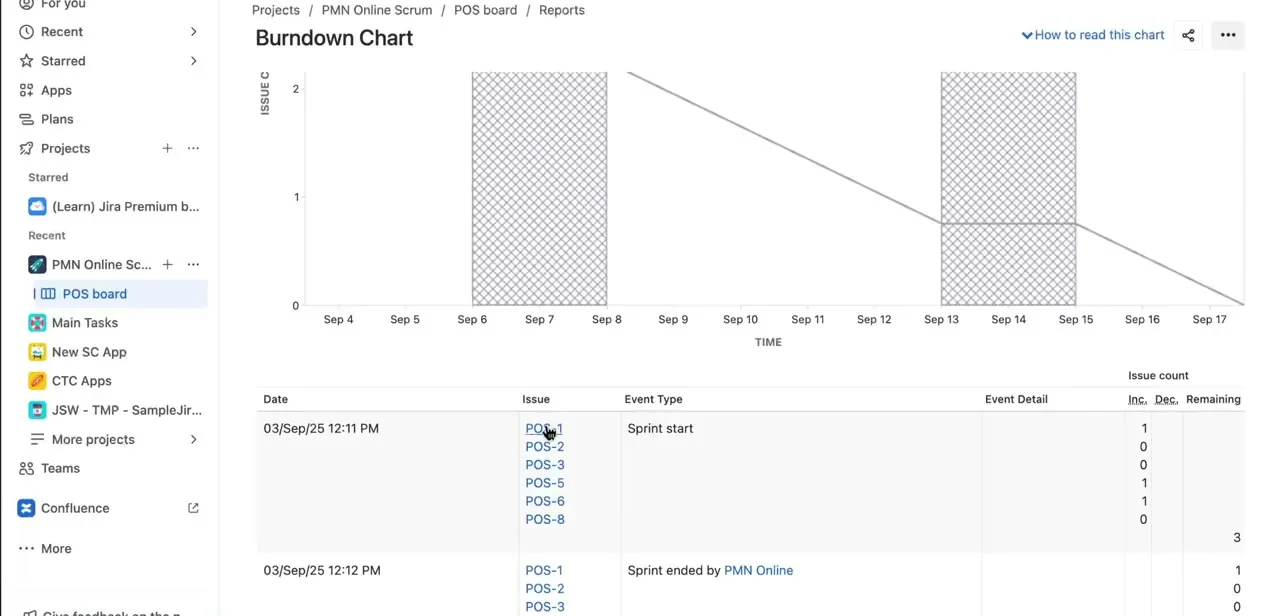
Scroll down past the chart itself to a table logging every event tied to the sprint by exact date and time — sprint start, sprint end, and each issue's movement in or out. Each row lists the issue keys involved, the event type, and columns for increase, decrease, and running remaining count, giving you a precise audit trail of what happened and when, down to the minute. This is the section to check when a sprint's outcome looks confusing from the chart alone — it answers exactly which ticket caused a jump or a stall.
05Cross-reference with the Sprint Report and Velocity Chart
Burndown Chart is one of several reports worth checking together — Sprint Report lists exactly which issues were completed versus not completed by the sprint's end, and Velocity Chart tracks completed work across multiple sprints so you can see whether your team's throughput is trending up, down, or holding steady. Looking at all three for the same sprint gives a fuller picture than any single chart alone, especially when explaining a missed sprint goal to stakeholders.
06Use the history to improve planning, not just to report on it
The real value of sprint history isn't the chart itself, it's what you do with the pattern it reveals — if velocity has been declining for three sprints, or the same type of ticket keeps getting pulled mid-sprint, that's a planning signal worth acting on before the next sprint starts. Pull up the last three to five sprints' reports together during backlog grooming or sprint planning rather than only looking back after something's gone wrong.
Frequently asked questions
Where do I find data for a sprint that already ended in Jira?
Open your board and go to the Reports tab rather than Active sprints, which only shows current or upcoming work. Reports holds Burndown Chart, Sprint Report, and Velocity Chart for every past sprint.
What's the difference between the Burndown Chart and the Sprint Report?
Burndown Chart shows work remaining over time as a visual trend line with a detailed event log. Sprint Report gives a simpler list view of exactly which issues were completed versus not completed when the sprint closed.
Why does the burndown line jump upward partway through a sprint?
That indicates scope was added mid-sprint — a new issue was pulled in after the sprint started. Check the event log below the chart to see exactly which issue caused the jump and when.
Can I compare velocity across several past sprints at once?
Yes — the Velocity Chart report plots completed story points or issue counts across multiple recent sprints in one view, which is the best report for spotting a trend rather than a single sprint's outcome.
Does switching the Burndown Chart's measurement from Issue count to Story points change historical data?
No, it only changes how the same historical data is displayed. The underlying events — what was completed, added, or removed and when — stay identical regardless of which unit you view the chart in.
About the author

Impran M N
I've been hooked on technology for as long as I can remember — especially the new tools and AI apps that seem to land every other week. Easy Tech Tuts is where I write up whatever I've just worked out: I do the task in the real product, record the screen, and turn it into the guide I wish I'd found first.