Easy Tech Tuts
How to Change Canvas Background Color in Power BI (Quick Design Tip) Easily 2026
By Impran M N
A default white canvas works fine, but adjusting the background color is one of the fastest ways to make a Power BI report feel intentional rather than generic. The setting itself takes about thirty seconds to apply once you know where it lives, but the difference between a report that looks like a template and one that looks designed usually comes down to exactly this kind of small formatting choice. This guide covers where the canvas background option is hiding, how to apply a color, and the transparency and wallpaper options sitting right next to it that most people never open.
01Start from a plain report page
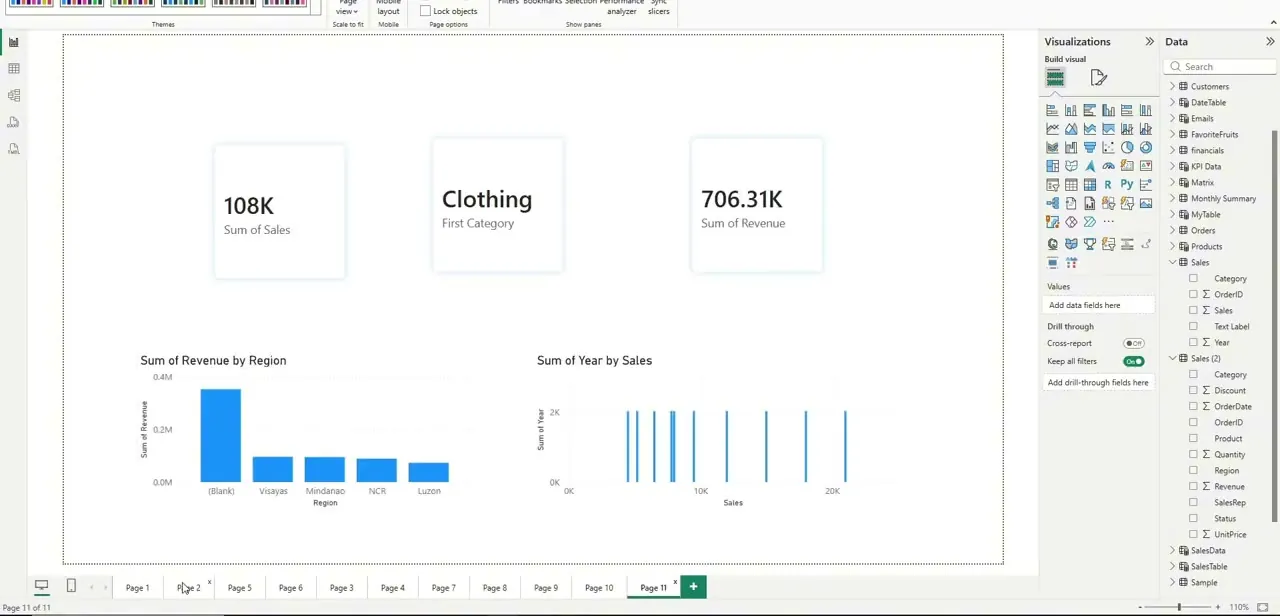
Here's a typical Power BI page before any background styling — white canvas, a few KPI cards up top, and a couple of bar charts below. It's perfectly readable, but every default Power BI report looks exactly like this, which is precisely the problem if you're presenting alongside other people's dashboards. The background is the fastest lever to pull to make a report visually distinct without touching a single visual.
02Click empty canvas space and open the Format pane
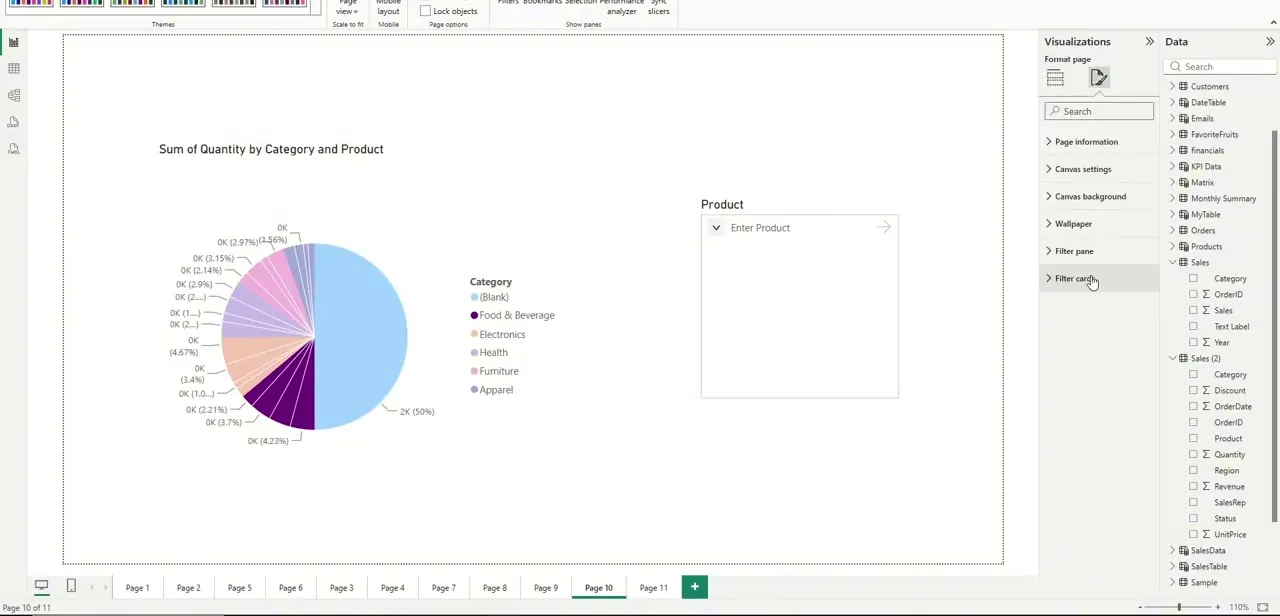
Click anywhere on the report page that isn't a visual, then open the Format pane on the right, which switches from the visual-specific formatting options to page-level ones. Here you'll find Page information, Canvas settings, Canvas background, and Wallpaper listed as separate collapsible sections — it's Canvas background specifically you want, not Canvas settings, which controls page size and layout instead. This distinction is where a lot of people get stuck searching in the wrong section.
03Expand Canvas background and pick a color
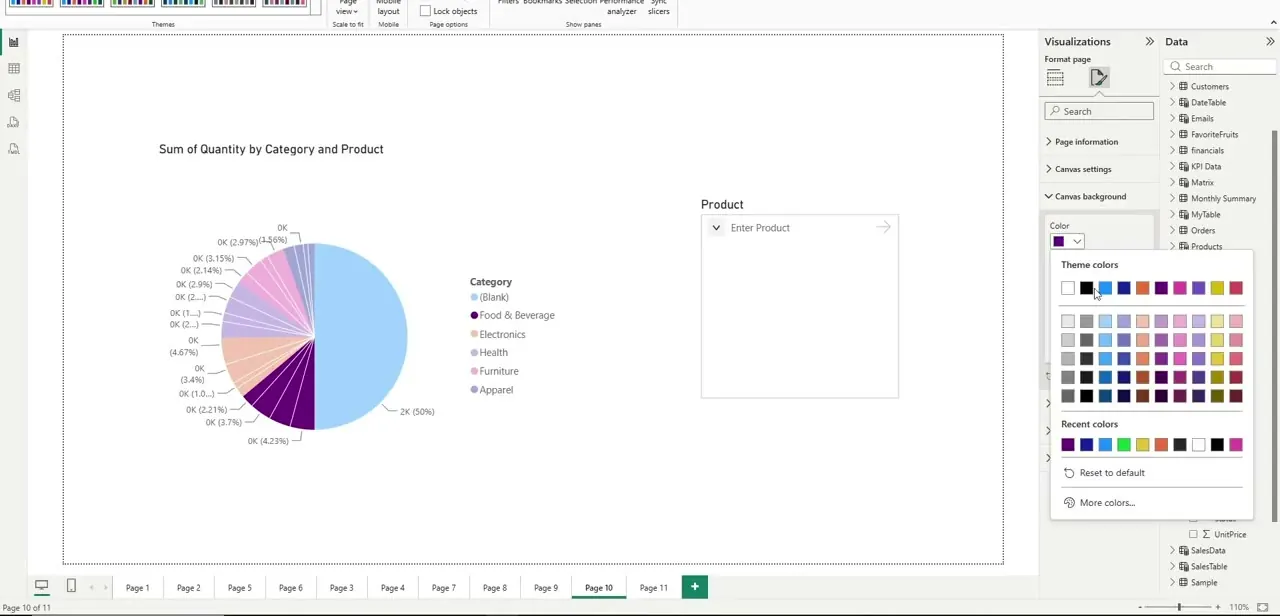
Clicking Canvas background reveals a Color swatch that opens a full palette when clicked — theme colors across the top row, tints and shades below them, and a Recent colors section that remembers whatever you've used on this report before. Stick to the theme color row if you want the background to stay coordinated with your report's existing chart colors, since those swatches are generated from the same theme rather than picked at random.
04See the applied color and adjust transparency
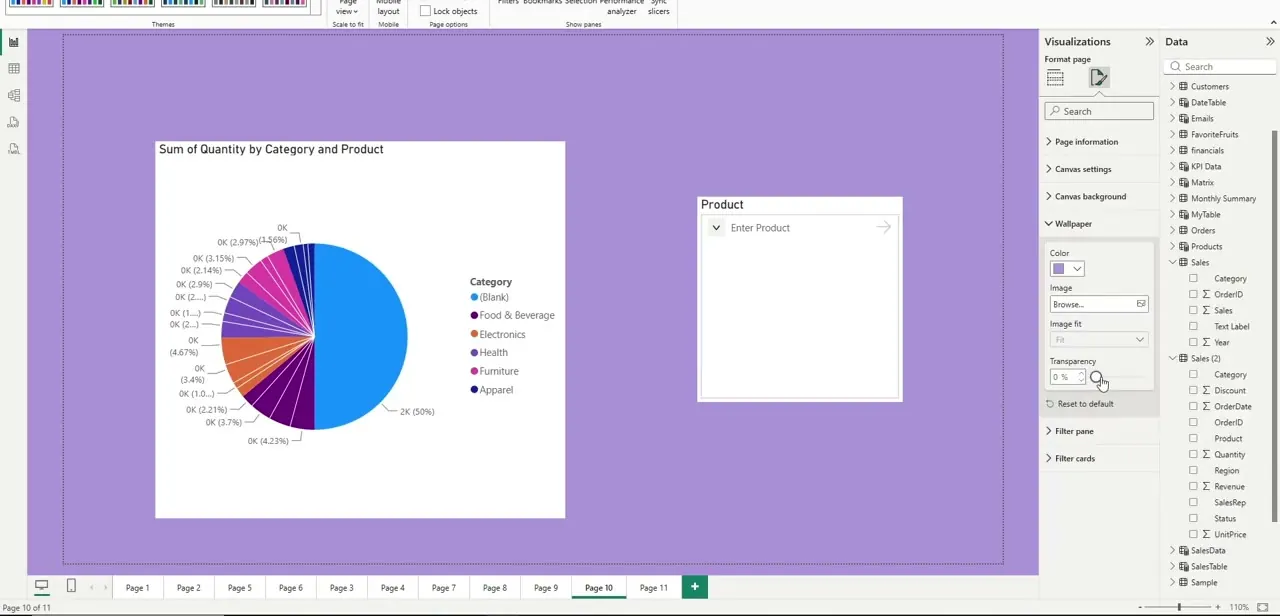
Once you pick a color, the entire canvas updates immediately — in this example a soft lavender-purple replaces the white, and the visual containers stay white by contrast, which is what keeps the charts readable against a colored backdrop. Notice the Transparency field sitting just below the Wallpaper section, currently at 0 percent; nudging that up lightens the effect if a fully saturated background feels too heavy once it's actually applied to a real report rather than a swatch.
05Try a wallpaper image instead of a flat color
Right below Canvas background, the Wallpaper section offers the same color-and-transparency controls plus an Image field where you can browse to upload a picture — a subtle texture, a company background, or a branded pattern — with its own Image fit setting to control whether it stretches, tiles, or fits the page. Wallpaper sits behind everything else on the page, so keep any image low-contrast or heavily faded; a busy background image fighting for attention against your charts defeats the purpose of adding one.
06Keep it consistent and don't overdo the contrast
Whatever color or wallpaper you settle on, apply it to every page in the report rather than just the one you were testing on — a background that changes page to page reads as unfinished rather than intentional. Favor muted, low-saturation colors over bright or heavily saturated ones; the background's job is to frame the data, not compete with it, and the safest test is whether your chart colors still pop the same way they did on plain white.
Frequently asked questions
Where do I find canvas background settings in Power BI?
Click on empty space on the report canvas, then open the Format page pane and look for the Canvas background section, listed separately from Canvas settings and Wallpaper.
Can I use an image instead of a solid color for the background?
Yes — the Wallpaper section sits right below Canvas background and lets you upload an image with its own transparency and Image fit controls, independent of the solid color option.
Will changing the canvas color affect how my visuals display?
It doesn't change the data or visual type, but a poorly chosen background color can reduce contrast and make some visuals harder to read — visual containers typically stay white by default, which helps preserve readability.
Can I apply a theme instead of manually setting colors?
Yes, Power BI supports report themes that can set canvas and visual colors consistently across the entire report in one step, and the theme color swatches in the background picker are pulled from whatever theme is active.
Should the background be the same on every page of my report?
Generally yes — keeping the canvas background consistent across pages makes a multi-page report feel cohesive rather than like several unrelated dashboards stitched together.
About the author

Impran M N
I've been hooked on technology for as long as I can remember — especially the new tools and AI apps that seem to land every other week. Easy Tech Tuts is where I write up whatever I've just worked out: I do the task in the real product, record the screen, and turn it into the guide I wish I'd found first.