Easy Tech Tuts
How to Create Reports in Zendesk Easily 2026
By Impran M N
Without visibility into support performance, it's hard to know where your team is struggling. Zendesk Explore lets you build custom reports from live ticket data without touching the underlying cases. This guide walks through picking a dataset, adding metrics and attributes, and turning the result into a visual chart.
01Open the Reports panel
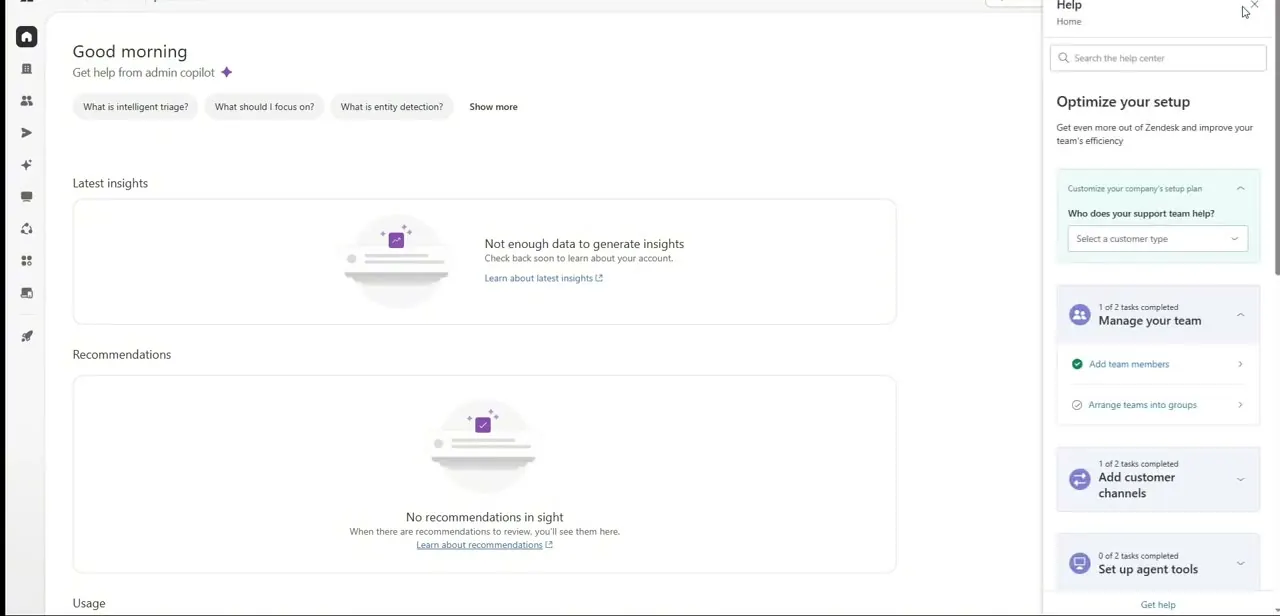
From the top product matrix, open Analytics and click the Reports icon in the sidebar.
02Choose your dataset
Click New Report and select a source dataset, such as Support - Tickets, that matches what you want to measure.
03Add a metric
Open the Metrics control block and add a counting value like Tickets or First Reply Time.
04Add attributes to slice the data
Drag categorization fields, such as Assignee Name or Ticket Status, into the Columns or Rows panel.
05Apply a date filter
Open the global Filters ribbon and constrain the dataset to a safe date range to avoid timeout errors on large queries.
06Choose a visualization and save
Switch the output into a bar or line chart using the Visualization menu, then enter a descriptive title and click Save.
Frequently asked questions
What's the difference between a metric and an attribute?
A metric is a quantitative value you count, like ticket volume, while an attribute is a qualitative label you use to slice the data, like assignee name.
Why does my report time out?
Large, unscoped date ranges can cause execution errors, so applying a date filter helps keep queries within safe limits.
Can I turn a saved report into a dashboard?
Yes, saved reports can be added to interactive multi-widget dashboards for team-wide visibility.
Does building a report change any live ticket data?
No, Explore is a read-only reporting layer that pulls data without modifying active tickets.
Watch the full walkthrough
The same steps, demonstrated on screen from start to finish.