Easy Tech Tuts
How to Calculate Project Level Percent Complete In Smartsheet Easily 2026
By Impran M N
Manually tracking overall project completion gets unreliable fast once you have dozens of subtasks each moving at their own pace. This guide covers formatting your % Complete column correctly, structuring tasks into parent-child rows so progress can roll up cleanly, and using conditional criteria to flag which tasks have actually hit 100%, so your project-level number reflects reality instead of a guess.
01Set up your % Complete column
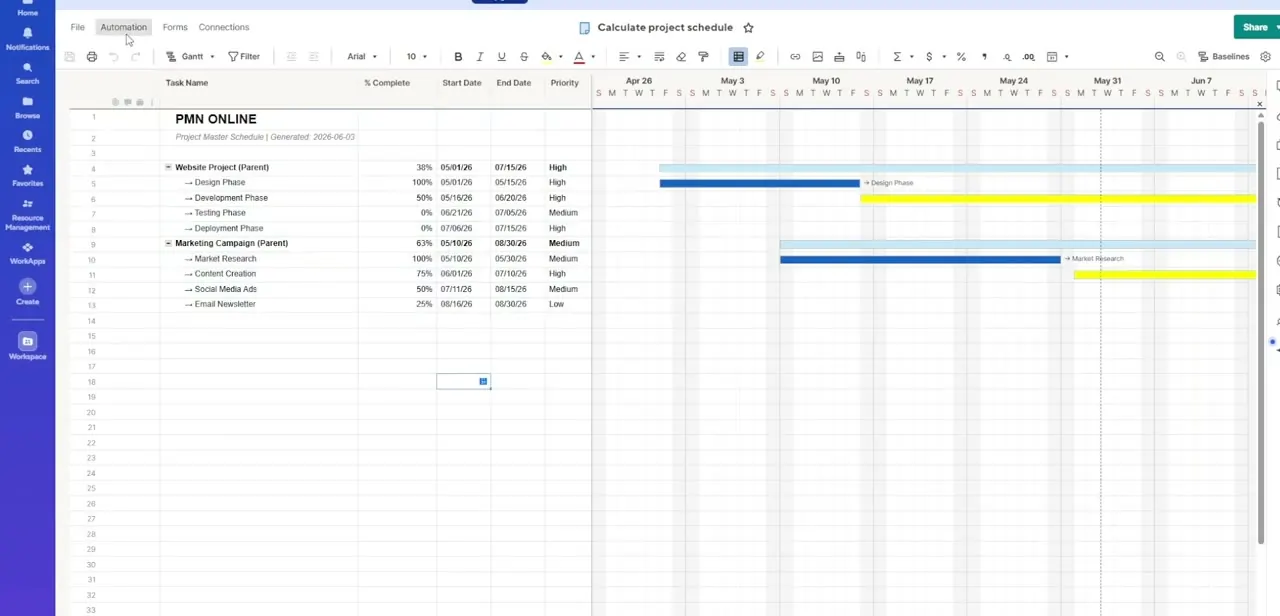
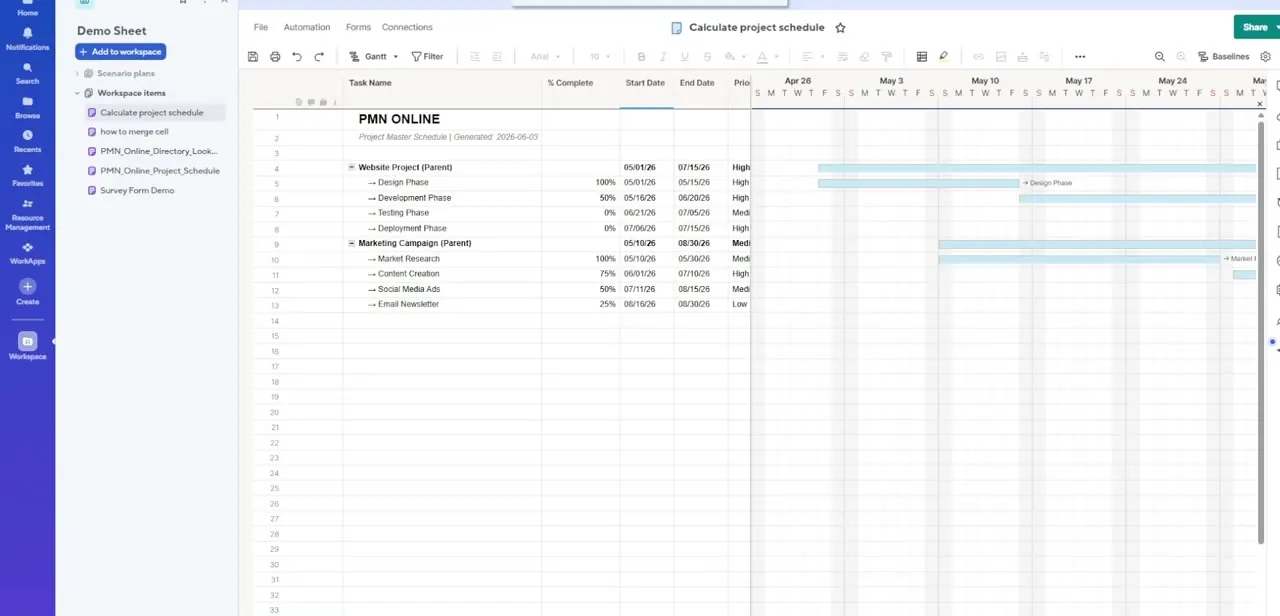
Open your schedule sheet and confirm the % Complete column sits next to your core tracking fields, Task Name, Start Date, End Date, and Priority. Each task row carries its own individual percentage, like 100% for a finished Design Phase or 50% for a Development Phase still underway, and this per-row number is the raw material every rollup calculation later depends on. If the column isn't formatted as a percent type, fix that first, since a plain number column won't display or calculate the way you expect.
02Organize tasks into parent-child rows
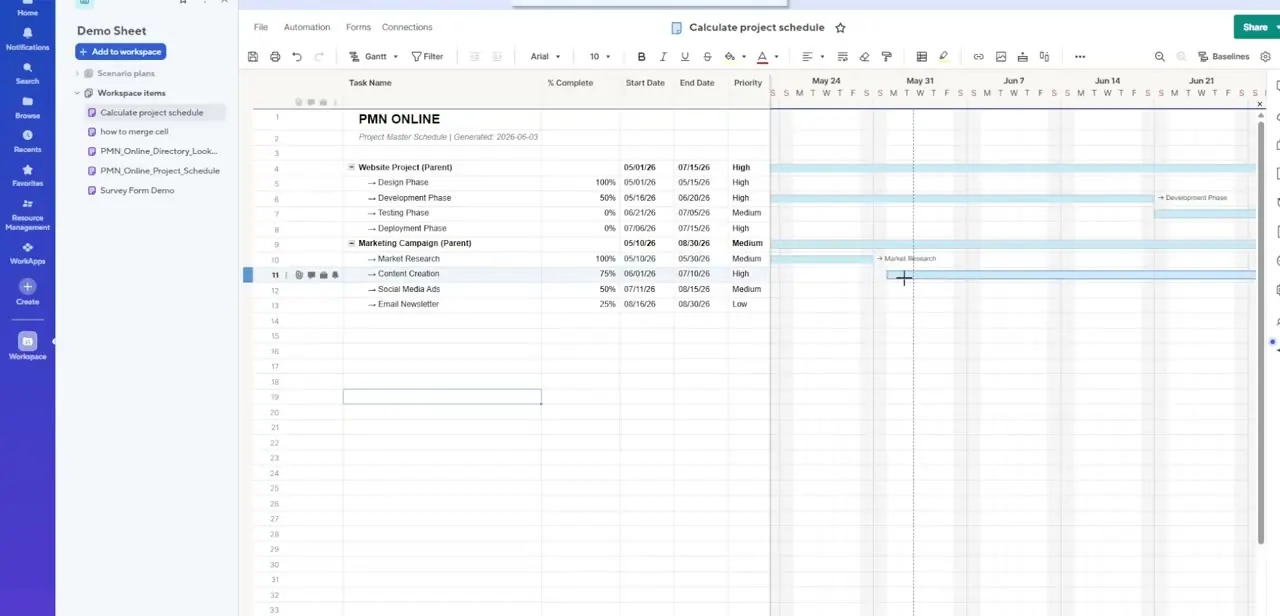
Group related tasks under a parent row, such as nesting Design Phase, Development Phase, Testing Phase, and Deployment Phase underneath a Website Project parent. This hierarchy isn't just visual organization, it's what a rollup formula reads to know which child rows belong to which parent when it calculates an aggregate percentage. Working further down the sheet and extending or adjusting a task's bar in the Gantt view is a normal part of this step, since the dates and hierarchy usually get refined together.
03Write a rollup formula on the parent row
In the parent row's % Complete cell, use a function like CHILDREN to reference its subtasks, or AVGW if you want to weight some tasks more heavily than others rather than averaging them all equally. A straight average treats a five-minute task the same as a two-week one, so weighting by duration or effort usually gives a more honest project-level number.
04Let the Dependencies Engine handle duration-based rollups
If your sheet has the Dependencies Engine enabled, Smartsheet can calculate progress natively through its automated Duration column mappings instead of you writing every formula by hand. This is worth turning on if your schedule already tracks durations and predecessors, since it keeps the rollup consistent with the same engine that's managing your timeline.
05Flag completed work with a condition
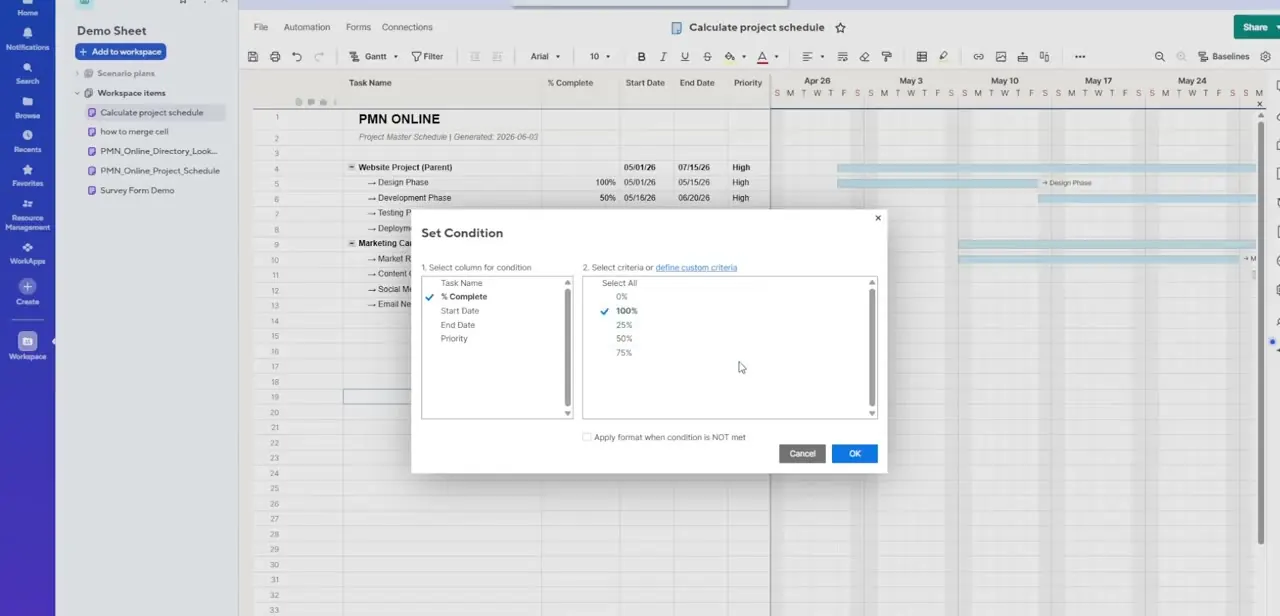
Open Conditional Formatting, select the % Complete column, and set a condition so rows hitting 100% are visually flagged, separate from the ones still at 25%, 50%, or 75%. Seeing which tasks are genuinely finished versus still in progress at a glance makes it much faster to sanity-check a rollup number before you present it, since a project that reports 80% complete should have a matching cluster of tasks actually sitting at 100%.
06Display the master number in Sheet Summary
Use the Sheet Summary panel to isolate a single project-level completion percentage as its own summary field, separate from the row-by-row detail in the grid. This is the number worth pinning to a dashboard or reporting up the chain, since it's the one figure that answers "where are we" without anyone needing to open the full sheet.
07Handle blanks and zero-day milestones
Watch for blank cells in child rows, since an empty % Complete value can throw off an average instead of counting as zero the way you'd expect. Zero-duration milestone rows can behave oddly in weighted formulas too, so it's worth testing your rollup formula against a task list that includes at least one blank and one milestone before trusting the number in a real report.
Frequently asked questions
How do I roll subtask progress up to a project-level percentage?
Use rollup formulas like CHILDREN and AVGW on parent rows, or enable the Dependencies Engine's automated duration-based calculation if your schedule already tracks durations.
Can I weight some tasks more heavily than others?
Yes, weighted rollup formulas such as AVGW let you factor task weight or duration into the overall completion calculation instead of averaging every task equally.
Where can I see the overall project completion number?
The Sheet Summary panel can display a single master field showing your project-level completion percentage, separate from the row-by-row detail.
What happens if some cells are blank?
Blank cells and zero-duration milestones can throw off rollup formulas, so it's worth testing your formula against real edge cases before relying on the result.
About the author

Impran M N
I've been hooked on technology for as long as I can remember — especially the new tools and AI apps that seem to land every other week. Easy Tech Tuts is where I write up whatever I've just worked out: I do the task in the real product, record the screen, and turn it into the guide I wish I'd found first.