Easy Tech Tuts
How to Generate Reports in Monday.com Easily 2026
By Impran M N
Manually rebuilding the same status spreadsheet every week gets old fast, and Monday.com's dashboards exist specifically to replace that habit. A dashboard pulls live numbers straight from your boards into charts and progress trackers that update themselves, so the report is never stale by the time someone opens it. This guide walks through creating a dashboard, connecting it to a board, and populating it with widgets from the Widgets Center, using an actual payment-status board as the working example.
01Start a new dashboard from your workspace
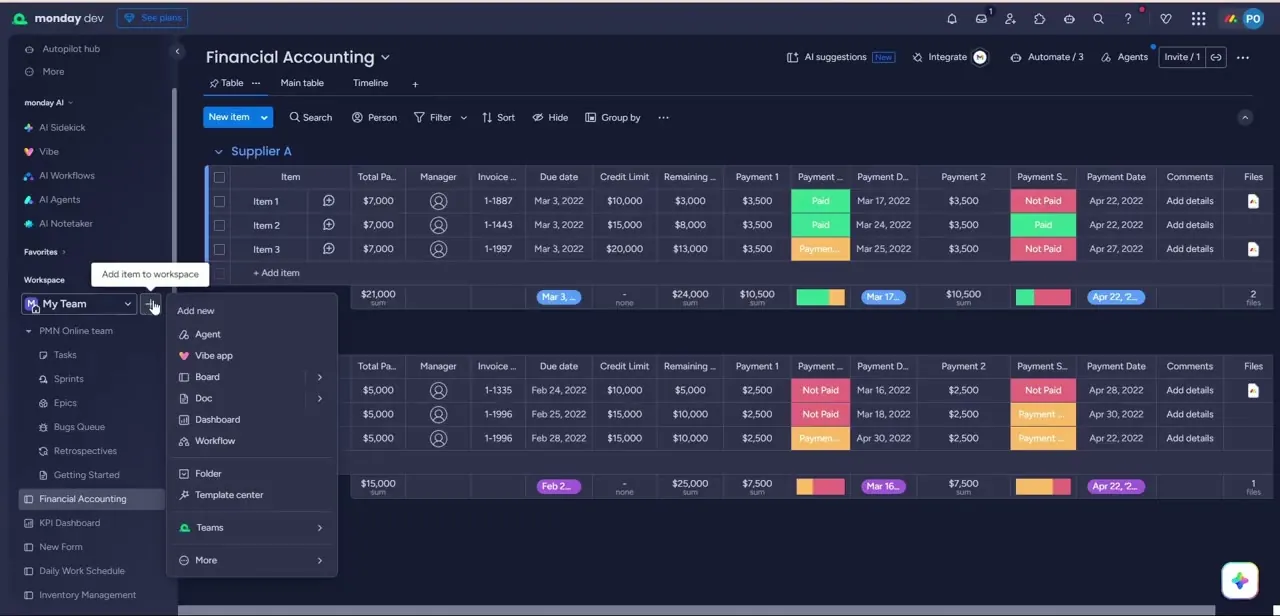
From your workspace sidebar, click the add button next to your workspace name to open the Add new menu. Alongside options like Board, Doc, and Folder, you'll see Dashboard listed with its own icon — that's the entry point for a reporting view rather than a working board. Picking it opens a short setup dialog instead of dropping you straight into an empty canvas, which is worth knowing so you're not caught off guard by the extra step.
02Name the dashboard and set its privacy
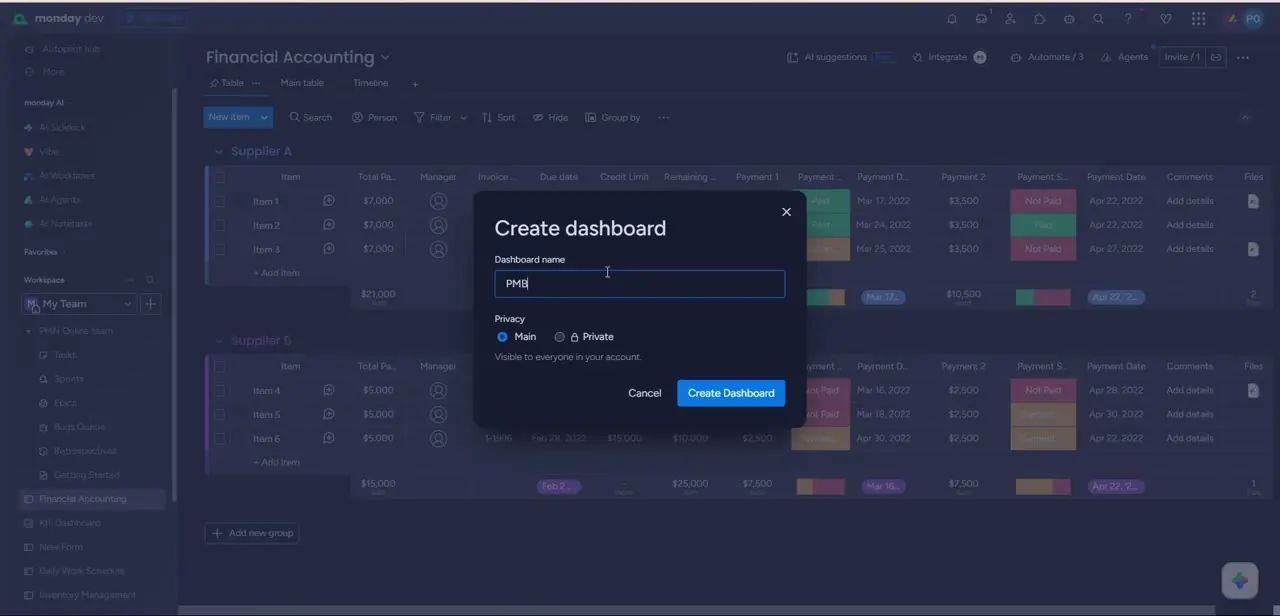
The Create dashboard dialog asks for just two things: a Dashboard name and a privacy setting of Main or Private. Main makes it visible to everyone in your account, which is the right call for a report leadership or multiple teams need to check regularly; Private restricts it to people you invite individually. Name it for what it reports on rather than who built it — something like "PMN Sales" or "Q3 Financial Accounting" reads clearly in a sidebar full of other boards and dashboards months later.
03Connect a source board before adding widgets
A brand-new dashboard opens with nothing on it and a prompt to add your first widget, but it's already been linked to at least one board during setup — you can see the connection confirmed near the top of the screen next to the Add widget button. Every widget you add afterward pulls its data from whichever boards are connected here, so if a number looks wrong later, this connection list is the first thing to check. You can connect additional boards at any time to bring more departments' data into the same view.
04Open the Widgets Center and pick a visualization
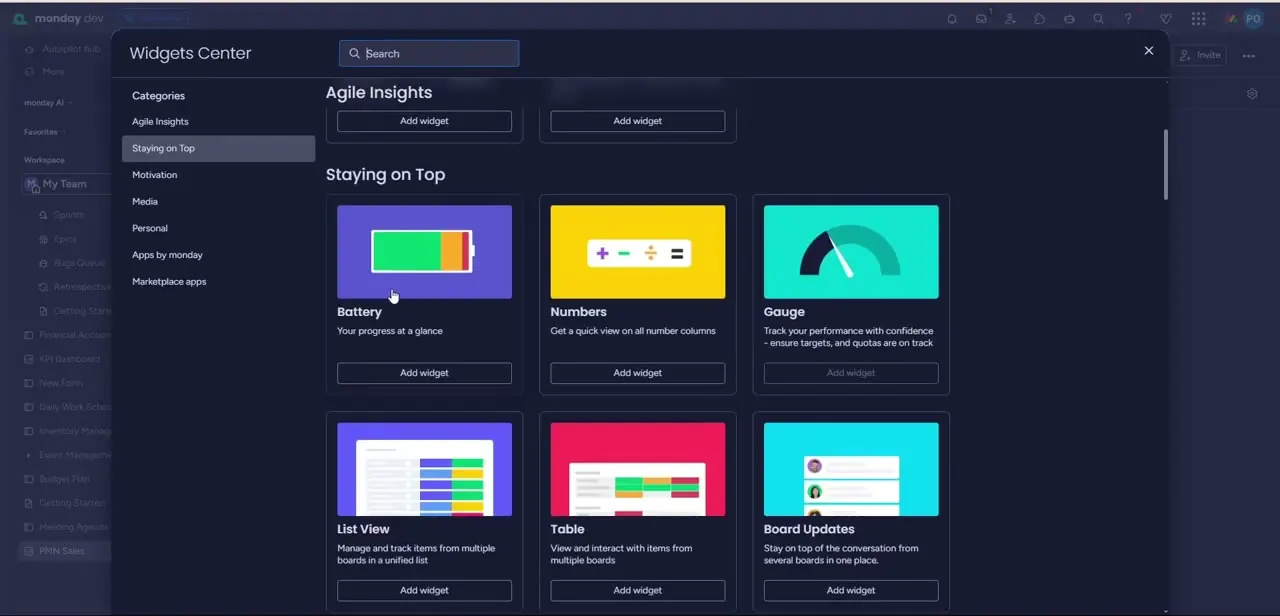
Clicking Add widget opens the Widgets Center, organized into categories like Agile Insights, Staying on Top, Motivation, and Media down the left side. Under Staying on Top you'll find Battery for progress-at-a-glance tracking, Numbers for a quick view across number columns, Gauge for target and quota tracking, plus List View, Table, and Board Updates for more detailed row-level reporting. Each tile shows a short description of what the widget does before you commit to adding it, which makes it easy to browse a few options rather than guessing from the name alone.
05Read the finished chart and progress widgets
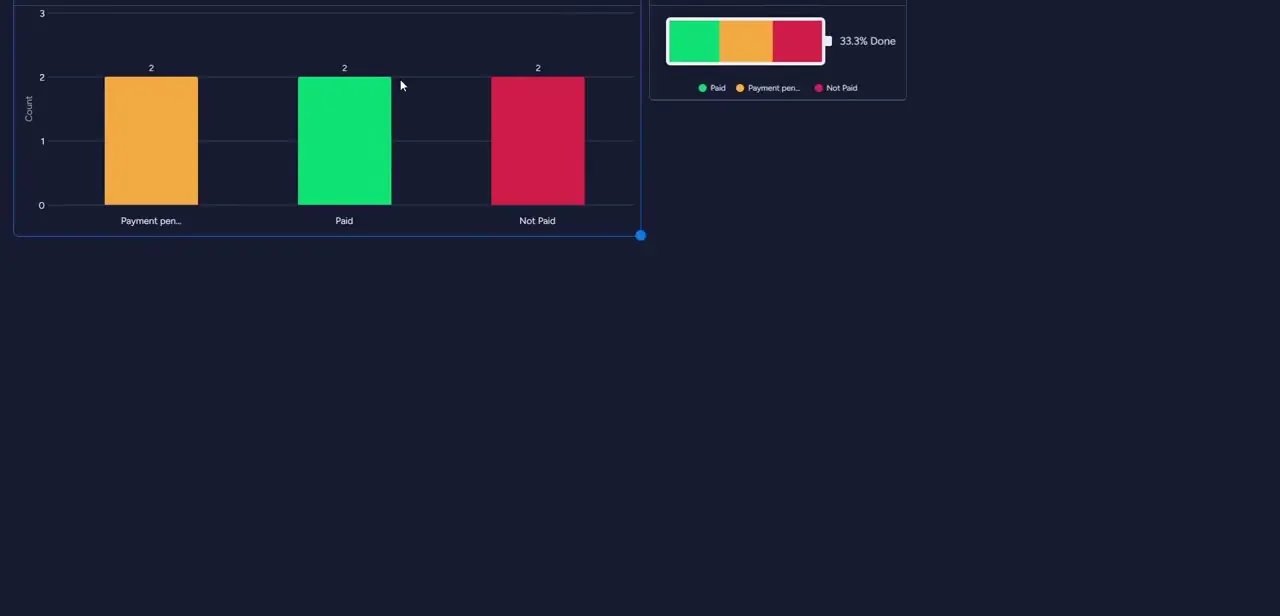
Once added, a chart widget turns raw status data into something scannable in one glance — a bar chart built from a payment-status column, for example, shows counts for Paid, Not Paid, and Payment pending side by side, using the same colors as the status labels on the source board. Placed next to it, a Battery-style widget rolls that same data into a single completion percentage, useful for a leadership view that doesn't need row-level detail. Because both widgets read live from the connected board, updating a status on the board updates the chart the next time the dashboard loads — no manual refresh of the report itself.
06Share the dashboard instead of exporting a static copy
Because a Monday.com dashboard is a live view rather than a snapshot, sharing the link is usually more useful to stakeholders than exporting a one-time file — the same dashboard reflects this week's numbers next week without anyone rebuilding it. That said, dashboards do support exporting underlying data for offline reporting or archiving when you specifically need a static file. If your team relies on a recurring written summary rather than a link, treat the dashboard as the source of truth and pull from it on a schedule, rather than maintaining a separate spreadsheet in parallel.
Frequently asked questions
What's the difference between a board and a dashboard in Monday.com?
A board holds the actual work items and data. A dashboard is a separate reporting layer that connects to one or more boards and displays their data through widgets like charts, tables, and progress trackers.
Can I pull data from multiple boards into one dashboard?
Yes. A dashboard can connect to more than one board, which is how you aggregate data across teams or departments into a single reporting view.
What widgets are available for reporting?
The Widgets Center includes chart types for visualizing trends, plus widgets like Battery, Numbers, Gauge, List View, Table, and Board Updates for progress tracking and row-level detail.
Does a dashboard update automatically?
Yes. Because widgets read live from the connected boards, the dashboard reflects the current state of the data each time it's opened, without any manual refresh of the report.
Should I make my dashboard Main or Private?
Choose Main if the report needs to be visible to everyone in your account, such as a team-wide status view. Choose Private if it should only be seen by specific people you invite.
About the author

Impran M N
I've been hooked on technology for as long as I can remember — especially the new tools and AI apps that seem to land every other week. Easy Tech Tuts is where I write up whatever I've just worked out: I do the task in the real product, record the screen, and turn it into the guide I wish I'd found first.