Easy Tech Tuts
How to Create a Custom Dashboard in Airtable Easily 2026
By Impran M N
Airtable's Interface Designer lets you turn raw base data into a visual dashboard with charts, number summaries, and grid elements without writing any code. This guide walks through building a dashboard from a blank canvas, connecting your data source, and publishing it with the right viewer permissions.
01Open the Interface Designer
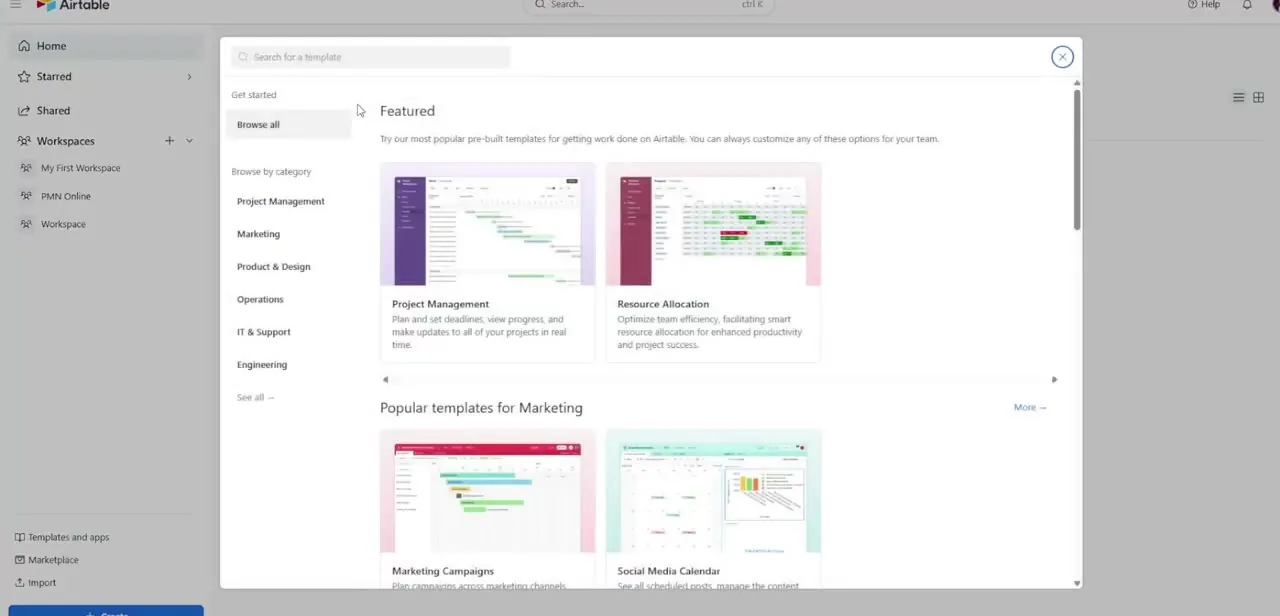
From your Airtable workspace, launch the Interface Designer hub to start building a new dashboard.
02Start a blank dashboard
Create a new interface page and select the blank dashboard template as your starting point.
03Connect your data source
Link the base tables that contain the data you want to visualize on the dashboard.
04Add visual components
Drag and drop chart components, number summaries, and grid elements onto the canvas to build out your layout.
05Configure widget settings
Adjust each widget's filters, grouping, and colors so it displays the specific data points you want.
06Publish with the right permissions
Rearrange the layout for clarity, then click Publish and set viewer access permissions before sharing.
Frequently asked questions
Do I need a paid Airtable plan to use Interface Designer?
Interface Designer is available on Airtable's plans, though some advanced widgets and viewer limits may depend on your specific plan tier.
Can viewers interact with the dashboard, or is it static?
You can add interactive filters that let viewers sort and adjust what data the dashboard shows without editing the underlying base.
What kinds of charts can I add to an Airtable dashboard?
You can add number summaries and various chart components tied directly to your linked base tables, configurable through each widget's settings.
Can I limit who sees the published dashboard?
Yes, when you publish you configure viewer access permissions to control who can open the interface.
Watch the full walkthrough
The same steps, demonstrated on screen from start to finish.