Easy Tech Tuts
How To Create Timeline In Smartsheet Easily 2026
By Impran M N
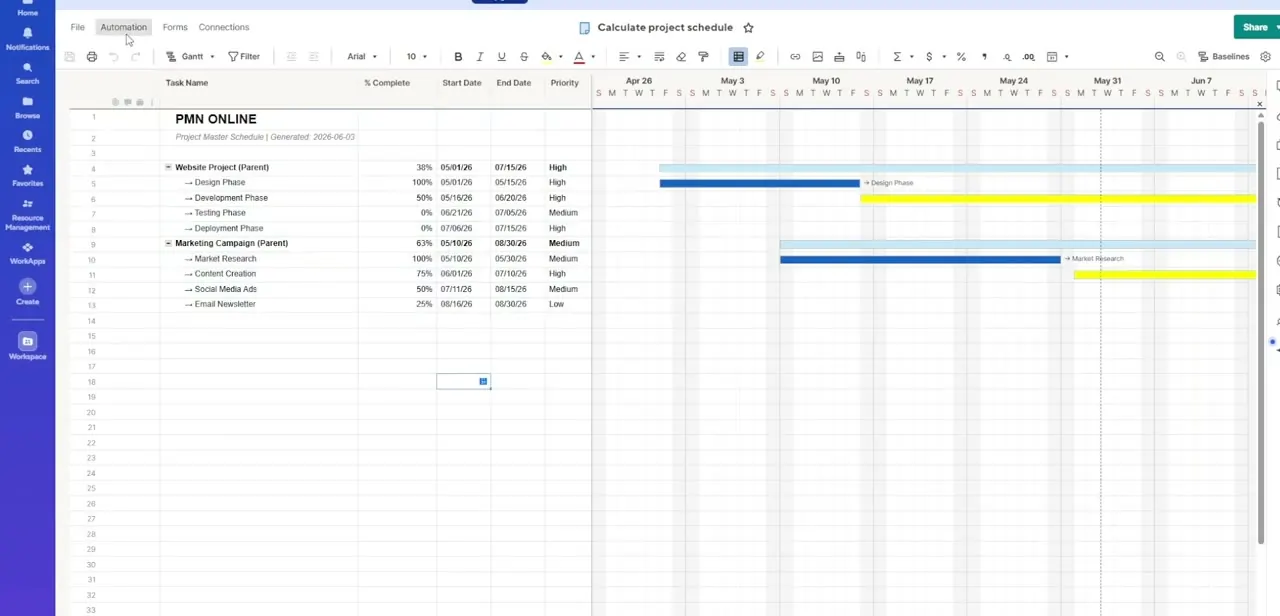
A visual timeline makes deadlines and milestones far easier to communicate than a plain list of dates. This guide covers setting up your date columns, activating the Gantt Chart view, adjusting the time scale, and marking key milestones with diamond markers.
01Set up your master timeline sheet
Create essential tracking columns: Task Name, Start Date, End Date, and Duration.
02Activate the Gantt Chart view
Turn on and customize the built-in Gantt Chart view for an instant visual timeline.
03Adjust the time scale
Format the timeline to display by Years, Quarters, Months, or Weeks depending on your project's length.
04Color-code your timeline bars
Use conditional formatting rules to automatically color bars based on task category, department, or status.
05Add milestone markers
Set task durations to zero to turn standard timeline bars into clear diamond milestone markers.
Frequently asked questions
How do I turn a task list into a visual timeline?
Activating the Gantt Chart view from your project settings converts your task rows into a visual timeline instantly.
Can I display my timeline by quarters instead of weeks?
Yes, the timeline's display scale can be adjusted to show Years, Quarters, Months, or Weeks.
How do I mark milestones on the timeline?
Setting a task's duration to zero turns its standard bar into a diamond-shaped milestone marker.
Can I color-code tasks by department?
Yes, conditional formatting rules let you automatically color timeline bars based on category, department, or status.
Watch the full walkthrough
The same steps, demonstrated on screen from start to finish.